During the FBI’s reprioritization process, the FBI Director shifted resources from traditional crime areas to terrorism-related programs. We obtained and reviewed data on planned and actual utilization of FBI resources and actual casework data to assess changes in the FBI’s investigative efforts between FYs 2000 and 2004.21 Our review focused on the FBI’s traditional crime-related investigative efforts, specifically the areas within the FBI’s Criminal Investigative Division (CID), such as drugs/narcotics trafficking, organized crime, violent crime, white-collar crime, and civil rights violations.
Our analyses revealed that the FBI’s CID is operating with significantly fewer resources than it had in FY 2000.22 Specifically, the FBI’s funded agents for CID-related programs in its 56 field offices decreased by 1,143 positions between FYs 2000 and 2004, declining from 6,896 to 5,753 during this time period. However, the FBI actually utilized 2,190 fewer field agents on traditional crime matters in FY 2004 than it had in FY 2000. In response to the reduction in criminal agent resources, the FBI directed field divisions to concentrate the majority of their criminal investigations on the most significant leads and cases. As a result, the FBI opened fewer criminal cases and referred fewer criminal matters to the USAOs in FY 2004 than it did in FY 2000.
The FBI allocates its resources throughout its Headquarters and field divisions by establishing Funded Staffing Levels (FSLs). One FSL equates to one funded employee, or one full‑time equivalent (FTE). These positions are assigned according to divisions, investigative programs (or subprograms), or support categories. For instance, allocated positions for agents in the field offices are allotted to specific programs, such as white-collar crime. The assignment of FSLs to the various field divisions, and specifically to programs, is the primary means by which the FBI implements its priorities and institutes its operational structure. Resource allocations represent the levels at which FBI executive management intends to address particular investigative areas.
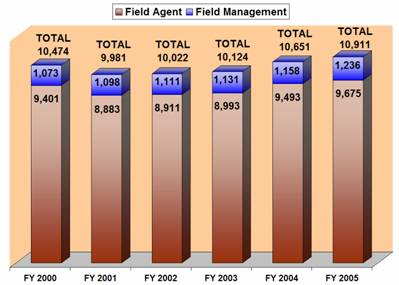
Between FYs 2000 and 2001, the FBI experienced an overall decrease in field agent FSLs, dropping from 10,474 agent positions to 9,981.23 Since that time, the number of allocated positions has steadily risen. The total number of field agents in FY 2005 (10,911) represents an increase of 437 over the number of FSLs in FY 2000. Exhibit 3‑1 illustrates the FBI’s field agent FSLs for FYs 2000 through 2005.
| EXHIBIT 3-1
TOTAL FUNDED STAFFING LEVELS FOR FBI FIELD AGENTS FISCAL YEARS 2000 THROUGH 2005 |
 |
| Source: OIG analysis of FBI Resource Management and Allocation (RMA) Office data |
Exhibit 3-1 also shows the composition of total field agent FSLs in terms of field agent and field management positions. Field agent positions, which are non‑supervisory, are allocated to specific programs, while field management positions, which are supervisory in nature, are allocated to field offices rather than to specific investigative areas. The non-supervisory field agent allocations mirrored the changes that occurred in the total number of field agent FSLs: a decline between FYs 2000 and 2001, followed by a steady increase through FY 2005. The field management positions, however, experienced an increase in each fiscal year throughout our review period.
Terrorism and Criminal Field Agent Allocations
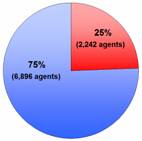
A major element of the FBI’s reprioritization efforts has been to reallocate FBI personnel resources and transfer agents from traditional criminal investigative areas to terrorism-related issues. The following charts provide a FY 2000 to FY 2004 comparison of the allocation of the FBI’s non-supervisory field agent workforce, according to the type of investigative matter to which they were assigned.
| EXHIBIT 3-2 COMPARISON OF FBI FIELD AGENT ALLOCATIONS IN TERRORISM AND CRIMINAL INVESTIGATIVE MATTERS FISCAL YEARS 2000 AND 200424 |
|
FISCAL YEAR 2000 |
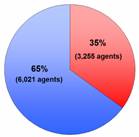
FISCAL YEAR 2004 |
 |
 |
 |
|
| Source: OIG analysis of FBI Resource Management and Allocation (RMA) Office data | |
In FY 2000 the FBI allocated 75 percent of its field agent workforce to criminal investigative areas, predominantly organized crime, drugs, violent crime, and white-collar crime. By FY 2004, the proportion of FBI field agents involved in criminal-related matters declined to 65 percent.
FBI Field Agent Resource Allocations within Traditional Criminal Programs
In our September 2004 report, we found that the FBI experienced reductions in the number of allocated field agent positions to CID programs from FYs 2000 through 2003. We extended our analyses in this review to include FY 2004 data and generally did not observe any significant changes between FYs 2003 and 2004.
Exhibit 3‑3 details the non-supervisory field agent FSL levels for CID‑related areas for FYs 2000 through 2004. The data in the table indicates that while there was a slight increase in criminal agent-allocated resources from FYs 2003 to 2004, the FBI still allotted more than 1,100 fewer field agents for traditional crime matters than it had in FY 2000. Therefore, the FBI planned to use significantly fewer resources in FY 2004 than it had in FY 2000. By far, the 732 agent reduction from drug and organized crime matters was the largest decrease among the crime areas.
| EXHIBIT 3-3
FIELD AGENT FUNDED STAFFING LEVELS ALLOCATED TO FBI TRADITIONAL CRIMINAL AREAS FISCAL YEARS 2000 THROUGH 200425 |
||||||
|---|---|---|---|---|---|---|
| 2000 | 2001 | 2002 | 2003 | 2004 | 2004-2000 | |
| Drug & Organized Crime | 2,279 | 2,078 | 1,511 | 1,521 | 1,547 | -732 |
| Violent Crime | 2,004 | 1,821 | 1,656 | 1,710 | 1,711 | -293 |
| White-Collar Crime | 2,460 | 2,404 | 2,210 | 2,303 | 2,342 | -118 |
| Civil Rights | 153 | 153 | 153 | 153 | 153 | 0 |
| TOTALS | 6,896 | 6,456 | 5,530 | 5,687 | 5,753 | -1,143 |
| Source: OIG analysis of FBI RMA Office data |
While the FBI develops a resource utilization plan through its FSL assignments, actual utilization of its resources often deviates from the plan due to local public safety threats and jurisdictional crime trends. The FBI tracks actual time worked by its field personnel in its Time Utilization and Recordkeeping (TURK) system. Field agent personnel record the percentage of time worked on investigative cases, which is converted in TURK to Average On-Board (AOB) data. One AOB equals one agent and refers to either: (1) one agent working solely in a single investigative area, or (2) multiple agents working part-time on the same investigation. For instance, three agents spending one-third of their time investigating a kidnapping is equivalent to one agent working the case fulltime, or one AOB. Unlike resource allocations (or FSLs), AOB is tracked by specific investigative classifications, which are assigned to programs or subprograms.26 An example is provided in Exhibit 3‑4.
| EXHIBIT 3-4
FBI INVESTIGATIVE NOMENCLATURE EXAMPLE |
|
|---|---|
| Category | Name |
| Program | Violent Crime |
| Subprogram | Violent Incident Crimes |
| Classification | Kidnapping |
Overall Criminal Agent Resource Utilization
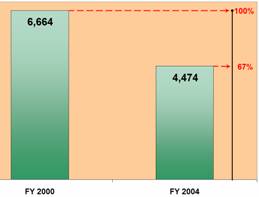
| EXHIBIT 3-5 FBI CRIMINAL AGENT RESOURCES FISCAL YEARS 2000 AND 2004 |
 |
| Source: OIG analysis of FBI TURK data |
In our September 2004 review, we reported that in FY 2003 the FBI utilized substantially fewer agent resources on criminal matters than it had in FY 2000. The FBI used 6,664 agents on traditional crime in FY 2000 compared to 4,639 in FY 2003 – a decline of 2,025 agents. Our current analysis revealed that the FBI utilized even fewer agents on criminal matters during FY 2004 than during FY 2003.
The FBI utilized 2,190 fewer criminal field agent resources in FY 2004 compared to FY 2000, declining from 6,664 agents to 4,474. Essentially, in FY 2004, the FBI was operating at 67 percent of its FY 2000 criminal agent resource level. These results are displayed in the chart in Exhibit 3‑5.
Criminal Agent Utilization After Implementing the Criminal Enterprise Plan
In Chapter 2, we discussed the FBI’s development of the Criminal Enterprise Plan and analyzed actual agent utilization data according to the CID’s new structure resulting from implementation of the Plan, as seen in Exhibit 3‑6. This analysis identified that the most noticeable reductions occurred within the Americas Criminal Enterprises and OCDETF programs, which primarily embody the FBI’s efforts to combat illegal drug trafficking.27 The reduction in resource utilization in these two programs coincides with the FBI’s plan to reduce its efforts to investigate drug-related crime. Further evaluation of agent utilization data is addressed in Chapters 5 through 11. Additionally, Appendix IV separately identifies the 30 FBI investigative classifications experiencing the greatest AOB reductions and increases between FYs 2000 and 2004.
| EXHIBIT 3-6 FBI AGENT UTILIZATION CHANGE IN SPECIFIC CRIMINAL AREAS FISCAL YEARS 2000 AND 2004 |
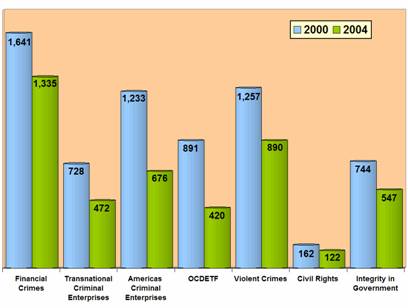 |
| Source: OIG analysis of FBI TURK data |
Comparison of Resource Allocation to Actual Utilization
As previously discussed, the FBI reduced the allocation of agent resources assigned to address traditional crime matters between FYs 2000 and 2004. Additionally, through analysis of FBI agent utilization data, we found that the FBI was, in fact, utilizing even fewer resources for criminal investigations than it had allocated.
In addition to the formally transferred 1,143 allocated field agent positions away from investigating drugs, violent crime, white-collar crime, and other traditional crime between FYs 2000 and 2004 (as detailed in Exhibit 3‑3), the FBI utilized over 1,200 fewer agents than it had allocated to these areas. Specifically, in FY 2004, of the 5,753 field agents allocated to criminal matters, the FBI utilized 4,474 of these agents – a difference of 1,279 agents. According to senior FBI officials, these agents were diverted to terrorism-related matters as needs arose. Adding these diverted agents to the planned reduction of 1,143 allocated field agent positions shows that the FBI reduced its investigative efforts related to traditional crimes by more than 2,400 agents, or more than twice the amount originally planned.
| EXHIBIT 3-7
EVALUATION OF FBI FIELD OFFICE CRIMINAL RESOURCES FISCAL YEARS 2000 AND 2004 |
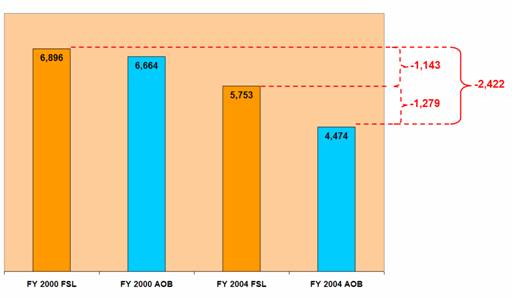 |
| Source: OIG analysis of FBI TURK and RMA Office data |
It was clear from our discussions with FBI Headquarters and field-level management that FBI field offices were directed to ensure that the FBI’s national priority areas were adequately staffed and that no terrorism-related matter went unaddressed, which explains the significant gap in the utilization and allocation figures. The FBI needs to ensure that it has accurately evaluated its investigative needs and necessary resource levels within each area of the FBI’s operations – including both terrorism and non-terrorism related programs – and translate this information into realistic and practical field agent allocations.
Breaking down our comparison of agent allocation and actual utilization to specific crime areas, we confirmed that the general crime areas investigated by the FBI experienced resource under-utilization during FY 2004. As Exhibit 3-8 illustrates, all general crime areas experienced significant gaps between funded staffing levels and actual utilization.
| EXHIBIT 3-8 COMPARISON OF FISCAL YEAR 2004 ALLOCATED CRIMINAL AGENT POSITIONS AND ACTUAL AGENT UTILIZATION 28 |
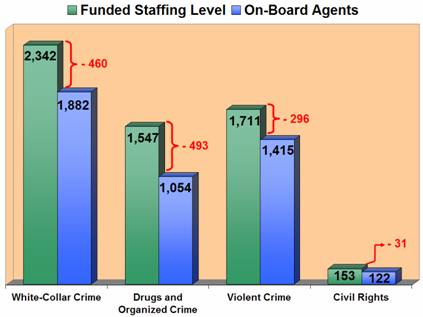 |
| Source: OIG analysis of FBI TURK and RMA Office data |
Reasons for Criminal Agent Underutilization
As discussed above, FBI criminal programs have utilized fewer agents than allocated in order to address terrorism-related matters, often using criminal resources. FBI field office management commented to us that it would not permit understaffed counterterrorism squads or tolerate any unaddressed terrorism lead. Besides utilizing criminal resources for terrorism-related matters, personnel vacancies, temporary duty assignments, and field division surveillance contributed to the underutilization of criminal agents.
Personnel Vacancies – According to many FBI officials interviewed, criminal squads absorb any field division personnel vacancies and are required to augment any understaffed counterterrorism squads. Field division management stated that criminal squads would suffer any agent vacancy within the division and that counterterrorism squads would be fully staffed at all times.
Temporary Assignments – Temporary assignment responsibilities remove agents from their field division duties, often for extended periods of time. We learned from discussions with FBI officials that if these agents are taken from a criminal squad, that squad will usually operate with one less agent. However, if the agent is chosen from a counterterrorism squad, a criminal agent will normally fill that vacancy so no counterterrorism squad is understaffed.
Surveillance Responsibilities – Each field office staffs a surveillance-specific unit, such as a Surveillance and Operations Group. This unit is tasked with providing necessary technical support to investigative cases, allowing case agents to concentrate on pursuing other case leads. To develop these groups, each investigative program assigns agents in accordance with the amount of support that program receives from the surveillance unit throughout the year. However, with the overall FBI emphasis on counterterrorism, many offices reported that surveillance resources are often monopolized by the counterterrorism squads, which have primary use of their services. As a result, criminal squads are left to conduct surveillance and technical operations by themselves. These tasks are usually resource-intensive and time-consuming, thereby preventing agents from pursuing other leads or performing other case-related work.
The FBI maintains its universe of data about its cases within its Automated Case Support (ACS) system. Similar to agent utilization data, ACS data is tracked at the specific investigative classification level and tracks the dates of case openings and closings. We analyzed this data to identify substantial changes in the number of case openings between FYs 2000 and 2004. Our analyses of ACS data help to quantitatively demonstrate an effect that reduced FBI criminal resources have had on the FBI’s operations.
We found the FBI opened over 28,000 fewer criminal cases in FY 2004 than it did in FY 2000.29 During FY 2000, the FBI initiated 62,782 criminal investigations. In FY 2004, that figure declined 45 percent to 34,451 cases. Exhibit 3‑9 depicts the case openings at the subprogram level for the FBI’s CID for FYs 2000 and 2004 and shows that each criminal area experienced a reduction during our 5-year review period. Notably, the Americas Criminal Enterprises Program, which addresses narcotics trafficking, gang-related crime, and major theft, experienced the greatest decline in case openings in terms of percentage, initiating over 50 percent fewer cases in FY 2004 than in FY 2000. Further, case initiations in Financial Crimes and Violent Crimes decreased by 6,939 (40 percent) and 15,236 (47 percent), respectively.
| EXHIBIT 3-9 FBI CASE OPENINGS IN SPECIFIC CRIMINAL AREAS FISCAL YEARS 2000 AND 2004 |
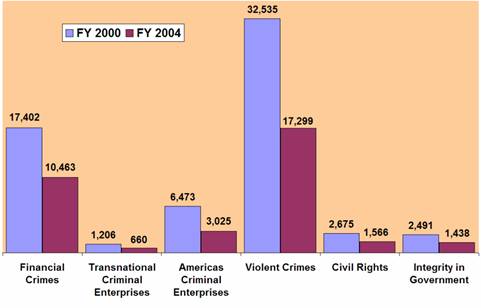 |
| Source: OIG analysis of FBI Automated Case Support (ACS) data |
Criminal Matters Received by United States Attorneys’ Offices
In addition to FBI casework data, we evaluated data from the United States Attorneys’ Offices (USAO), including the number of criminal matters the FBI and other federal law enforcement agencies referred to the USAOs during FYs 2000 and 2004.30 Analysis of this data provides insight into the effect the FBI’s reduction in investigations of traditional criminal cases has had on the overall enforcement of criminal activity by the federal government.
It is important to note that “criminal matter” is not synonymous with “criminal case.” A “criminal matter” involves information submitted to a USAO for review; a “criminal case” only refers to instances in which defendants have been charged. Therefore, in assessing actual FBI investigative efforts, we believed the USAO’s “criminal matters” data to be more appropriate for our review. The USAO tracks criminal matters received for numerous criminal categories.
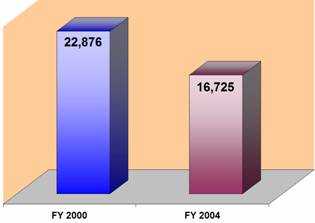
In FY 2004, the FBI referred approximately 6,100 fewer criminal–related matters to the USAOs than in FY 2000 (a 27-percent reduction).31 As the following exhibit shows, the FBI referred 22,876 criminal-related matters during FY 2000; this figure declined to 16,725 for FY 2004. Additional analyses of USAO case management data for specific crime areas are contained in Chapters 5 through 11.
| EXHIBIT 3-10
FBI CRIMINAL MATTERS REFERRED TO THE USAOs FISCAL YEARS 2000 AND 2004 |
 |
| Source: OIG analysis of United States Attorneys’ (USA) central case management system data |
Comments from FBI Personnel on Effects of Reprioritization
In addition to statistical impact, FBI field division personnel commented to us on the qualitative effects of the FBI’s criminal resource reductions. As discussed earlier, FBI officials said that criminal squads often operate understaffed. Moreover, most field divisions function with fewer criminal squads compared to four years ago. Additionally, several non-FBI law enforcement officials and USAO representatives commented to us that less experienced agents tended to work criminal cases, while counterterrorism matters were staffed by more experienced agents. FBI field division management generally confirmed these comments. Thus, the FBI is investigating criminal matters with less experienced personnel than that devoted to counterterrorism matters, as well as with a fewer number of agents and fewer criminal squads. In certain instances, USAO officials stated that this has resulted in fewer matters being referred to the USAOs.
Some FBI field managers commented that undermanned squads could jeopardize the safety of criminal investigative agents. FBI officials reported that criminal agents often attempted to handle pre‑9/11 squad caseloads, even though each squad operated significantly understaffed. FBI field managers commended the agents’ work ethic but were concerned that the agents were going to “burn out” mentally and physically. Additionally, some FBI officials commented that the morale of criminal agents was diminishing because most of the recognition went to those agents involved in terrorism-related matters.
- When available and appropriate, we include FY 2005 data. In general, we did not use FYs 2001 and 2002 data in comparative analyses, as the events of 9/11 and the FBI’s response to investigating the terrorist attacks skewed utilization data during that time period.
- Our previous report, which included analyses of FBI data between FYs 2000 and 2003, detailed similar results.
- The FBI experienced an overall decline in FSLs from FYs 2000 to 2001. This reduction was primarily a result of a mandate issued by the Office of Management and Budget (OMB), which has become known as the “hollow work year” issue. During FY 2001 (but prior to 9/11), OMB ordered the FBI to reduce its reported number of funded positions because OMB believed the FBI did not have sufficient money to fund its level of authorized positions.
- We categorized FBI activities as terrorism-related or criminal-related based on the program in which the work was captured. We considered terrorism-related work to be captured in the National Foreign Intelligence, Domestic Terrorism, and National Infrastructure Protection/Computer Intrusion programs. We considered criminal-related work to be captured in the Civil Rights, Criminal Enterprise Investigations, Cyber Crime, Organized Crime/Drug, Violent Crime/Major Offenders, and White-Collar Crime programs.
- Allocation figures are displayed according to the FBI’s allocation categories used in FYs 2000 through 2004. In FY 2005, the FBI allocated its field agent positions in accordance with the CID ’s new organizational structure. For example, instead of allocating positions to organized crime and drugs, positions are now allocated to Transnational Criminal Enterprises and Americas Criminal Enterprises. This change precludes us from comparing resource allocation data from FYs 2000-2004 to FY 2005.
- At the beginning of FY 2005, the FBI had over 630 investigative classifications.
- OCDETF is the acronym for Organized Crime Drug Enforcement Task Force, a congressionally funded program administered by the Criminal Division in the DOJ that focuses on the disruption and dismantling of major drug trafficking organizations.
- We conducted this analysis according to the CID program areas to which the FBI allocated resources in FY 2004.
- We identified these case openings by segregating the investigative areas for which the FBI CID was responsible after its reorganization in FY 2004.
- Appendix V lists the federal agencies included in our analyses of USAO criminal referrals. Appendix VI provides the criminal categories used by the USAOs and details the number of referrals for each category from the FBI and all agencies combined for FYs 2000 and 2004.
- The figures presented for criminal-related matters include all non-terrorism related referrals to the USAOs. For purposes of this report, we considered the matters referred to the USAOs that are categorized as Internal Security Offenses to be terrorism-related.