Integrating budget and performance has been an important government initiative to ensure “that performance is routinely considered in funding and management decisions, and that programs achieve expected results and work toward continual improvement.”1 To measure performance, federal agencies develop long-term strategic plans to provide the President, Congress, and the public an overview of the challenges agencies face and their goals and objectives for meeting these challenges.
This review examined the Department of Justice's (DOJ) Strategic Plan for Fiscal Years (FY) 2003-2008. That plan included four strategic goals: (1) Prevent Terrorism and Promote the Nation's Security; (2) Enforce Federal Laws and Represent the Rights and Interests of the American People; (3) Assist State, Local, and Tribal Efforts to Prevent or Reduce Crime and Violence; and (4) Ensure the Fair and Efficient Operation of the Federal Justice System.2
The strategic goals are broken down into specific long-term outcome goals that state what DOJ hopes to achieve in the future. The outcome goals represent the activities that are considered DOJ’s highest priorities.
Key indicators are used to measure annual progress toward achieving these outcome goals. Figure 1 illustrates the relationship between strategic goals, outcome goals, and key indicators.
FIGURE 1: RELATIONSHIPS BETWEEN STRATEGIC GOALS, OUTCOME GOALS, AND KEY INDICATORS
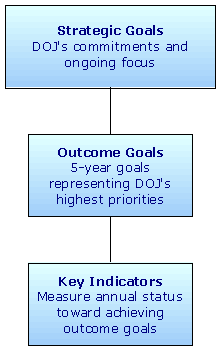
Source: Justice Management Division management and U.S. Department of Justice Strategic Plan for Fiscal Years 2003-2008
The Office of the Inspector General (OIG) conducted this audit at the request of the Department to determine whether DOJ’s data collection, storage and validation processes, and data limitations reported for its key indicators were complete and accurate.
According to officials in the Department’s Justice Management Division (JMD), in order to ensure confidence in DOJ reporting, the Department needs to provide the most accurate data available. Additionally, components must include all key indicators and their performance data in their annual budget requests, which can affect budget and management decisions. The key indicator information is also presented in the annual Budget and Performance Summary to demonstrate DOJ achievements and plans for future accomplishments. Key indicator reporting also enables more accurate assessment and monitoring of any agency’s efforts to achieve outcome goals and strategic success. Further, accurate reporting assists DOJ in identifying areas in need of improvement and increased focus.
In cases when a key indicator target is not achieved, JMD officials explained that the affected DOJ component may meet with the Assistant Attorney General for Administration to discuss the program performance and the corrective actions necessary to achieve that target in the future.
Key Indicator Reporting
As mentioned previously, the Department’s key indicators are included in DOJ’s annual Budget and Performance Summary, which accompanies the President’s budget. Each fiscal year, key indicator performance data is also reported in the Performance and Accountability Report (PAR), which consolidates Department financial and performance information into a single report.
For each key indicator, the PAR includes a discussion of the data collection and storage processes, data validation and verification processes, and any data limitations. In addition to reporting key indicator performance data, the PAR includes narrative sections describing whether the key indicator target was achieved and progress toward the outcome goals.3 If key indicator performance data for a fiscal year is incomplete in that year’s PAR, revised data can be included in the next calendar year’s Budget and Performance Summary and in the subsequent PAR.
Department of Justice Guidance
Annually, JMD Budget Staff assists in developing and revising the DOJ Financial Statement Requirements and Preparation Guide. According to the FY 2006 version of this guide, reporting by the components begins in May when they provide a draft of their Management Discussion and Analysis (MD&A) to JMD. The MD&As are revised until the final drafts are submitted to JMD in October. The certified final MD&As include the actual performance data and a discussion of performance for the fiscal year. JMD extracts the information provided in the components’ MD&As to prepare DOJ’s PAR. JMD does not generally adjust the information provided in the components’ MD&As, as the PAR is considered a consolidation of the components’ MD&As.
The PAR must be submitted to the President, Congress, and the Office of Management and Budget (OMB) 45 days after the September 30 fiscal year end.
Recent Guidance
In November 2007, the President issued Executive Order 13450, entitled “Improving Government Program Performance.” This order requires federal agencies to establish measurable and clearly defined performance goals. This order places additional emphasis on the importance of key indicators and the quality of data used to report on those indicators, since those indicators will be the foundation for each agency to measure accomplishment of its goals and assist in its budgeting process.
Audit Approach
The purpose of our audit was to determine whether each key indicator we examined met the following criteria: (1) data collection and storage processes were complete and accurate, (2) data validation and verification processes were complete and accurate, and (3) data limitations provided by the agency were complete and accurate. Our audit did not assess whether the key indicators were the best measures to evaluate progress on achieving DOJ’s goals.
Our audit covered the FY 2006 PAR, which included 28 DOJ key indicators. We did not conduct audit work on seven key indicators that were either discontinued or were long-term measures still in the process of developing a baseline at the time of our audit.4
We conducted our audit work at JMD and 17 DOJ components. These components were responsible for reporting on the 21 audited key indicators, which are listed by strategic goal in Table 1.
TABLE 1: DOJ KEY INDICATORS INCLUDED IN THE AUDIT
| KEY INDICATORS LISTED BY STRATEGIC GOAL | COMPONENT |
|---|---|
| Strategic Goal I: Prevent Terrorism and Promote the Nation’s Security | |
| Terrorist Acts Committed by Foreign Nationals Against U.S. Interests within U.S. Borders | FBI |
| Strategic Goal II: Enforce Federal Laws and Represent the Rights and Interests of the American People | |
| Number of Organized Criminal Enterprises Dismantled | FBI |
| Number of Child Pornography Websites or Web Hosts Shut Down | FBI |
| Consolidated Priority Organization Target-Linked Drug Trafficking Organizations Disrupted and Dismantled | FBI, DEA, OCDETF |
| Number of Top-Ten Internet Fraud Targets Neutralized | FBI |
| Number of Criminal Enterprises Engaging in White-Collar Crimes Dismantled | FBI |
| Percent of Cases Favorably Resolved | EOUSA and Litigating Divisions5 |
| Percent of Assets/Funds Returned to Creditors for Chapter 7 and Chapter 13 | USTP |
| Strategic Goal III: Assist State, Local, and Tribal Efforts to Prevent or Reduce Crime and Violence | |
| Reduction of Homicides per Site Funded Under the Weed and Seed Program | OJP |
| Percent Reduction in DNA Backlog | OJP |
| Number of Participants in the Residential Substance Abuse Treatment Program | OJP |
| Increase in the Graduation Rate of Drug Court Program Participants | OJP |
| Strategic Goal IV: Ensure the Fair and Efficient Operation of the Federal Justice System | |
| Number of Judicial Proceedings Interrupted Due to Inadequate Security | USMS |
| Federal Fugitives Cleared or Apprehended | USMS |
| Per-Day Jail Costs | OFDT |
| System-wide Crowding in Federal Prisons | BOP |
| Escapes from Secure Bureau of Prisons Facilities | BOP |
| Comparative Recidivism Rates for Federal Prison Industries Inmates versus Non-Federal Prison Industries Inmates | BOP, FPI |
| Rate of Assaults in Federal Prisons (Assaults per 5,000 Inmates) | BOP |
| Inspection Results – Percent of Federal Facilities with American Correctional Association Accreditations | BOP |
| Percent of Executive Office for Immigration Review Priority Cases Completed Within Established Time Frames | EOIR |
In conducting our audit, we reviewed current laws, regulations, guidelines, and policies to examine key indicator reporting requirements with which federal agencies must comply. These requirements are detailed in Appendix II.
Our fieldwork consisted of interviewing component personnel; reviewing relevant policies and procedures; and assessing processes related to data collection, storage, validation, and verification. We also discussed applicable data limitations with component personnel. In addition, we verified the performance data reported in the FY 2006 PAR and 2008 Budget and Performance Summary.
Our fieldwork was conducted concurrent with DOJ components’ preparation of the MD&As for the FY 2007 PAR, which was issued in November 2007. Due to the timing of our audit, we discussed our preliminary audit results with DOJ components and JMD officials before the PAR was completed. This process was important to ensure that components were able to implement revisions to the FY 2007 MD&As, which were used to compile the FY 2007 PAR. Delayed presentation to the components of the issues and deficiencies identified in our audit would have resulted in the reporting of inaccurate and incomplete information in the DOJ’s FY 2007 PAR. As a result, as part of this audit we analyzed the FY 2007 PAR, which was modified in response to our preliminary findings, and due to our audit work, we are including the components’ revisions throughout this report.6
Results in Brief
Our audit concluded that DOJ components reporting on 12 of the 21 DOJ key indicators audited had: (1) adequate data collection and storage processes, (2) sufficient data validation and verification processes, and (3) complete and accurate disclosure of data limitations. However, we identified the following deficiencies and issues related to the remaining 9 of the 21 key indicators: (1) the data collection processes, which could, and in some cases did, result in under- or over-reporting; (2) incomplete and inaccurate data; (3) the scope of the data collected by some of the components was incomplete; (4) the scope of the data presented in the FY 2006 PAR for some key indicators was inaccurate; (5) some detailed information in the FY 2006 PAR did not directly illustrate what the title described; and (6) some key indicators did not disclose data limitations and other information that needed to be disclosed in the PAR.
Overall, we found that component management had implemented a variety of different processes to review and validate the MD&As prior to providing them to JMD for compilation in the PAR. However, the deficiencies and issues identified in 9 of the 21 key indicators suggest that the review and validation processes were not sufficiently effective to ensure accurate and complete performance data and an accurate presentation of the performance information in the MD&As and the PAR. In our opinion, components need to improve their validation processes by verifying the accuracy of MD&A narratives covering the key indicators and the supporting information necessary to ensure the accuracy of the key indicator performance data. Further, components should communicate to staff the need for accuracy of the key indicator information presented in the MD&A for PAR reporting.
Although we recognize that JMD officials cannot currently verify or adjust information provided by the components, we believe that JMD should expand its role to improve the accuracy of the key indicator performance data reported in the components’ MD&As, which are subsequently compiled for the PAR. To accomplish this, through a formal policy JMD should require the necessary supporting information from components to authenticate the accuracy of the key indicator performance data.
Our report contains 12 recommendations that focus on specific steps that JMD and the components should take to improve the: (1) data collection and storage processes, (2) data validation and verification processes, and (3) data limitation disclosures for the DOJ’s key indicators.
We discuss the specific deficiencies we found in nine of the key indicators in the following section.
Summary of OIG Findings
Our audit identified specific deficiencies and issues related to the following nine key indicators.
Number of Child Pornography Websites or Web Hosts Shut Down - FBI
This key indicator identifies the number of child pornography websites and web hosts shut down and is measured by the Innocent Images National Initiative, a component of the FBI’s Cyber Crimes Program. In performing its mission, the Innocent Images National Initiative is involved in issuing subpoenas to web hosting companies and Internet service providers to obtain subscriber information in order to investigate who developed the website and who is responsible for it. The service of a subpoena does not in and of itself result in a website shutdown. However, according to the FBI, upon receiving a subpoena web hosting companies and Internet service providers will routinely shut down the website because the subpoena notifies them of an ongoing investigation of sexual exploitation of children and they do not want this material on their servers. The FBI explained that the service of a subpoena is how the FBI determines the number of websites and web hosts shut down. FBI officials explained that they do not have data to comprehensively count the total number of websites shut down through its interventions with Internet service providers.
We determined that t his key indicator is not fully accurate since the FBI has no direct technical role in shutting down websites. This indicator measures the number of child pornography websites and web hosts shut down, while the FBI captures this data by counting the number of subpoenas served. As a result, this key indicator does not reflect the work and activities of the FBI.
Number of Top-Ten Internet Fraud Targets Neutralized - FBI7
This key indicator measured the number of top-ten Internet fraud targets neutralized. Neutralization occurs when the fraud targets are unable to perpetuate their frauds any further. According to the FY 2006 PAR, “The FBI and the National White Collar Crime Center partnered in May 2000 to support the Internet Crime Complaint Center (IC3).” The IC3 collects Internet fraud complaints through its website and refers Internet fraud cases to FBI field offices and state and local law enforcement agencies. To identify neutralization information and report on this indicator, the IC3 searches the Internet, liaisons with the field offices, and also depends on FBI field offices and state and local law enforcement agencies to provide neutralization information. However, FBI field offices and state and local law enforcement agencies have the discretion to decide whether referrals are used to open cases and pursue investigations. Additionally, we found that no requirements exist regarding the use of the referred case information or for FBI field offices and state and local law enforcement agencies to report back to IC3 regarding neutralizations that were a result of the IC3’s referred cases information. As a result, the IC3 may not receive feedback from FBI field offices and state and local law enforcement agencies and cannot assure the accuracy of neutralization information for this key indicator.
Percent of Cases Favorably Resolved – EOUSA and the Litigating Divisions
This key indicator measures the percent of civil and criminal cases favorably resolved, which includes cases resulting in court judgments and settlements favorable to the government. EOUSA and the DOJ litigating divisions are responsible for representing the U.S. government in federal court. At the time of our audit, EOUSA and each of the six litigating divisions included in this indicator maintained separate and unrelated case management systems. We found that EOUSA and the litigating divisions are using two different dates to report on the percentage of cases favorably resolved – the case disposition date and the system date. The disposition date is the date that the disposition or decision occurred. The system date is the date the disposition is entered into the case management system. Consequently, using two different dates for the data runs provides inconsistent results. We brought this condition to the attention of management at both EOUSA and the litigating divisions during the course of our audit. Subsequently, EOUSA and the litigating divisions took action to address the condition in the FY 2007 PAR by disclosing the different dates that are used to collect the data for this key indicator.
Additionally, we found that the Civil Rights Division included cases in the data provided to JMD that should not have been reported. The data definition section of the PAR states, “The data set includes non-appellate litigation cases closed during the fiscal year.” However, the Civil Rights Division included appellate cases in the information provided to JMD. As a result, the percentage of civil cases favorably resolved was understated and the percentage of criminal cases favorably resolved was overstated.
Finally, we found that in some instances the U.S. Attorneys Offices and the litigating divisions are reporting the same case to JMD. As a result, duplicate cases are included in the data consolidated by JMD for this key indicator. During the course of our audit, we brought this issue to the attention of management at both EOUSA and the litigating divisions. Subsequently, EOUSA and the litigating divisions took action to address the issue in the FY 2007 PAR by disclosing that cases worked on by more than one component continue to be duplicated in the totals for this indicator and will continue to be duplicated until the litigation case management system (a single shared case management system for EOUSA and the litigating divisions) is fully implemented.
Percent of Assets/Funds Returned to Creditors for Chapter 7 and Chapter 13 - USTP
This key indicator measures the percent of assets and funds returned to creditors for bankruptcies filed under Chapter 7 and Chapter 13. In Chapter 7 bankruptcy proceedings, assets that are not exempt from creditors are liquidated. For Chapter 13, debtors repay a portion or all of their debt over 3 to 5 years. According to the FY 2006 PAR, “The U.S. Trustee Program was established nationwide....” However, we found that U.S. Trustees are not in all 50 states in the United States. Specifically, in Alabama and North Carolina bankruptcy cases are still administered by the courts. This issue was brought to the attention of the Executive Office for U.S. Trustees (EOUST) management during the course of our audit. Subsequently, EOUST corrected this issue in the FY 2007 PAR by disclosing the two states not included in this key indicator.
Reduction of Homicides Per Site Funded Under the Weed and Seed Program - OJP
This key indicator measures the reduction of homicides per site funded under the Weed and Seed Program and the average number of homicides per Weed and Seed site. The OJP Community Capacity Development Office (CCDO) is responsible for the Weed and Seed Program. The CCDO collects the Weed and Seed data and uses the assistance provided by the Justice Research and Statistics Association (JRSA) to analyze the data. We found that the CCDO did not accurately represent the time periods covered by the data presented in the FY 2006 PAR. We reviewed the summary reports provided by the JRSA and did not find any discrepancies with the number of homicides per Weed and Seed site that were reported for FYs 2004 and 2005. However, these reports used data from the FYs 2004 and 2005 Government Performance and Results Act (GPRA) Reports, which included data covering calendar years 2003 and 2004. Therefore, the data presented in the FY 2006 PAR does not cover FYs 2004 and 2005 but instead covers calendar years 2003 and 2004.
Additionally, using the summary reports we did not find any discrepancies with the 17.8 percent reduction of homicides per site funded under the Weed and Seed Program reported for FY 2005 in the FY 2006 PAR. However, we found that the data sets used to report on the number of homicides per Weed and Seed site included data from all reporting sites irrespective of whether reporting occurred in previous years. Therefore, the data sets used were not comparable from one year to the next because different grantees were included in each data set. In order to calculate the reduction, a data set that is limited to sites with data for both years should be used.
We discussed and identified additional data limitations for this key indicator with CCDO and JRSA personnel. Our primary concern was that the Weed and Seed grants have 5-year designations. Therefore, grantees may be at a different phase in their program depending upon the number of years they have been receiving grant funds. Additionally, grantees do not begin the 5-year designation at the same time. Therefore, the scope of the data changes each year as new grantees are added and other grantees reach the end of their 5-year designation. Finally, CCDO and JRSA personnel informed us that not all Weed and Seed sites are comparable. Some of the differences include population demographics and population size. Therefore, the data for this key indicator is difficult to compare across years and among sites. During the course of our audit, we brought these issues to the attention of CCDO management. Subsequently, CCDO took action to address the condition in the FY 2007 PAR by disclosing the additional data limitation.
Number of Participants in the Residential Substance Abuse Treatment Program – OJP
This key indicator measures the number of participants served by the Residential Substance Abuse Treatment (RSAT) grant program, which funds treatment activities focusing on substance abuse, including treatment in a residential treatment facility operated by state correctional agencies. The OJP’s Bureau of Justice Assistance (BJA) requires annual RSAT Reports that collect information regarding the grantee’s previous fiscal year. However, the scope of each grantee’s fiscal year may be the federal government fiscal year, the calendar year, or the state’s fiscal year. As a result, the key indicator data reported by the grantees, when compiled, includes various data scopes.
Additionally, in the FY 2006 PAR the BJA reported 35,350 RSAT program participants for 2005. Using the spreadsheet provided by the BJA, BJA pointed out that for 2005 it should have reported a total of 31,740 RSAT program participants. Therefore, the number of RSAT program participants was overstated by 3,610 participants or 10.21 percent. We discussed this issue with BJA management during the course of our audit. Subsequently, BJA addressed the issue in the FY 2007 PAR by disclosing the error and reporting the correct number of RSAT participants for 2005.
Finally, in the FY 2006 PAR, the BJA disclosed the following data limitation, “Statutorily mandated calendar year reporting requirement.” However, the data is presented as “FY 2005 Actual” data in the PAR and as mentioned previously, we found that the data is reported based on the grantee’s fiscal year, which represents various time periods that are neither exclusively federal fiscal year nor calendar year data. Therefore, the data limitation and the scope of the data presented in the PAR are contradictory. We brought this issue to the attention of BJA management during the course of our audit. Subsequently, BJA took action to address the issue in the FY 2007 PAR by disclosing that the performance data is collected according to the grantee’s fiscal year and the scope of the fiscal year may not be the same for all grantees.
Increase in the Graduation Rate of Drug Court Program Participants - OJP
This key indicator measures the increase in the graduation rate of drug court program participants. The drug court program combines substance abuse treatment, sanctions, and incentives with case processing to assign eligible defendants a treatment provider with educational resources and programs. We found that the 31.9 percent graduation rate of drug court participants reported for FY 2006 in the FY 2006 PAR does not encompass an entire fiscal year. Instead, it represents January through June of FY 2006. Therefore, the drug court graduation percentage reported in the FY 2006 PAR is inaccurate because it represents 6 months instead of a 12-month period. Further, this may affect the 13.8 percent increase in the graduation rate reported in the FY 2006 PAR.
We also found that the BJA did not present the accurate scope of the performance data in the FY 2006 PAR. Specifically, we found that the data reported in the FY 2006 PAR is presented as fiscal year data. However, we found that the data actually represents the state’s fiscal year data under the data collection methodologies described by the BJA. During the course of our audit, we brought this issue and the previous issue to the attention of BJA management. Subsequently, BJA took action to address these issues in the FY 2007 PAR by disclosing its processes to collect data for a consecutive 12-month period, disclosing the scope of that 12-month period, and presenting the accurate scope of its performance data.
Finally, JMD uses the DOJ components’ MD&A to draft the PAR and is responsible for generating the bar graphs in the PAR. We found that the bar graph for this key indicator in the FY 2006 PAR is titled, “Increase in the Graduation Rate of Drug Court Program Participants,” but the bar graph displays the graduation percent, not the graduation percent increase. The current bar graph compares the graduation rates over several years and illustrates the 31.9 graduation percent instead of the actual 13.8 percent increase from year to year. We brought this issue to the attention of JMD management during the course of our audit. Subsequently, JMD took action to address the issue in the FY 2007 PAR by revising the title of the bar graph.
Comparative Recidivism Rates for FPI Inmates versus Non-FPI Inmates - FPI, BOP
This key indicator compares recidivism rates of inmates who participated in the Federal Prison Industry (FPI) and inmates who did not participate at 3 years and 6 years after release from a secure facility. For this key indicator, recidivated cases are individuals who are arrested and returned to the legal system. We identified two additional data limitations that were not disclosed in the FY 2006 PAR.
First, we found that Vermont, Maine, and Washington, D.C., are not participating in the FBI’s Interstate Identification Index (III). Therefore, if a BOP-released inmate was arrested in any of these jurisdictions, it may not be reported in the FBI’s III. Specifically, if the inmate was returned to a BOP facility, SENTRY would capture this data. However, if the inmate was returned to a state or local facility in one of these jurisdictions, the FBI’s III would not capture this data. As a result, this information would not be reported and included within the BOP's statistical model that generates the results reported in the PAR. Additionally, BOP personnel explained that for the same reason the following states may be under-represented in the recidivism data: New Jersey, North Carolina, Oregon, Florida, Kentucky, Hawaii, Maine, and Idaho.
Second, according to BOP personnel, a data lag can occur between the time an inmate is arrested and when the information is entered into the state’s record management system or into SENTRY. This limitation may cause the results reported in the PAR to be under- or over-reported. We determined that t his data limitation was also not disclosed in the FY 2006 PAR.
Rate of Assaults in Federal Prisons (Assaults per 5,000 Inmates) - BOP
This key indicator measures the rate of assaults in federal prisons per 5,000 inmates. For this key indicator, assaults include “inmate on inmate” and “inmate on staff,” and both serious and less serious assaults. In the FY 2006 PAR, the BOP reported the FY 2006 rate of assaults per 5,000 inmates as 119. Using the “Inmate Assessment for Acts of Misconduct Report” provided by BOP personnel, we found that for FY 2006 the BOP should have reported 116 as the rate of assaults per 5,000 inmates. As a result, we found that the BOP overstated the rate of assaults by 2.76 percent.
The specific deficiencies and issues are discussed in detail in the Findings and Recommendations section of this report, organized by the four strategic goals reported in the DOJ’s Strategic Plan for FY 2003-2008. Detailed information regarding our audit objectives, scope, and methodology appears in Appendix I.
U.S. Office of Management and Budget, The Federal Government is Results-Oriented: A Report to Federal Employees, August 2004, which summarizes how the federal government is focusing on results, the role of the President’s Management Agenda, and the key to future success. The integration of budget and performance was previously addressed in the Government Performance and Results Act (GPRA) of 1993 and the Reports Consolidation Act of 2000, and is also addressed in the guidance on implementation in the Office of Management and Budget (OMB) Circulars A-11 and A-136. This guidance is discussed further in Appendix II.
Due to the timing of our audit work and the review’s scope, this report discusses the Department’s FY 2003-2008 Strategic Plan. In 2007, the Department issued a Strategic Plan for FY 2007-2012, which includes three broad strategic goals: (1) Prevent Terrorism and Promote the Nation’s Security; (2) Prevent Crime, Enforce Federal Laws, and Represent the Rights and Interests of the American People; and (3) Ensure Fair and Efficient Administration of Justice. The three goals encompass some of the same outcome goals and key indicators that were contained in the previous plan’s four Strategic Goals.
See Appendix III for a comprehensive list of all 28 key indicators included in the FY 2006 PAR and Appendix IV for background information on these key indicators.
The following six litigating divisions are included in this indicator: Antitrust, Civil, Civil Rights, Criminal, Environment and Natural Resources, and Tax Divisions. Throughout this report we use the term “litigating divisions” to refer to these six divisions. The key indicator data for the Executive Office for U.S. Attorneys (EOUSA) and the litigating divisions is consolidated by JMD Budget Staff.
Our review of the FY 2007 PAR and any changes that were made as a result of our audit are discussed in detail in the Findings and Recommendations section of this report, which is organized by the four strategic goals reported in the DOJ’s Strategic Plan for FY 2003-2008.
In the FY 2006 PAR examined by our audit, the key indicator was titled, “Number of Top-Ten Internet Fraud Targets Neutralized.” However, the key indicator was revised in the 2008 Budget and Performance Summary to the “Number of High-Impact Internet Fraud Targets Neutralized.”