PREVALENCE OF ACCESS PROBLEMS
Access to Information Problems Exist, But Overall They Are Not Large Problems for the Survey Respondents.
More than one-fourth of responses overall reported no access problems. Figure 3 shows that the percent of responses indicating no access problems was almost the same for the three government groups.
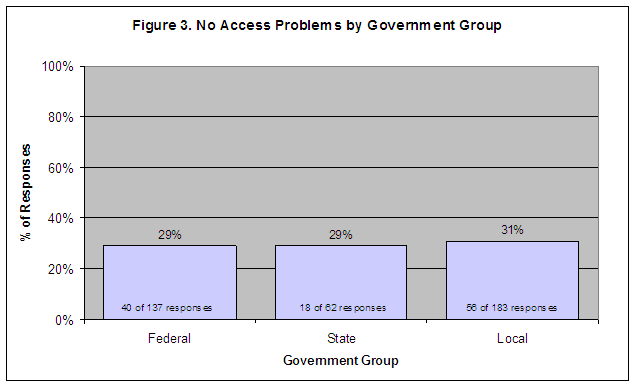
| Source: Survey responses to Questions 11, 19, 27, and 35: What percentage of your financial audits, performance audits, evaluations/inspections, investigations involve access to information problems?
Note: Figure data excludes the “no answer” responses. Numbers are rounded. The number of responses for each government group represents the combined responses for Questions 11, 19, 27, and 35. Details on the total number of respondents to each question by government group are in Appendix II |
Figure 4 shows the percent of responses by function indicating no access problems.
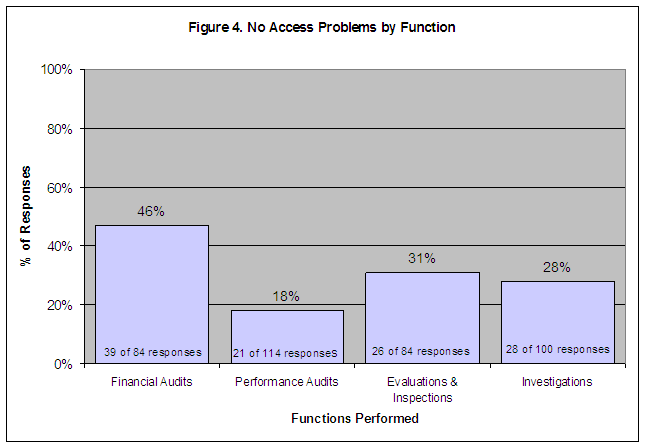
| Source: Survey responses to Questions 11, 19, 27, and 35: What percentage of your financial audits, performance audits, evaluations/inspections, investigations involve access to information problems?
Note: Figure data excludes the “no answer” responses. Numbers are rounded. Details on the total number of respondents to each question by government group are in Appendix II. |
Some responses indicated that access to information problems occur in more than 25 percent of reviews. The federal response rate for problems in more than 25 percent of reviews was slightly higher than the state and local response rates. Figure 5 shows the percent of responses by government group indicating access problems in more than 25 percent of reviews for all functions.
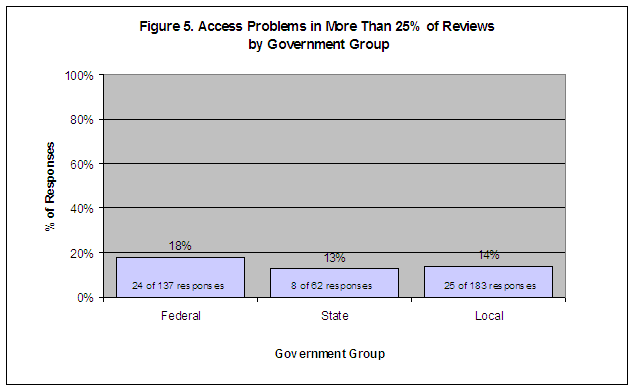
| Source: Survey responses to Questions 11, 19, 27, and 35: What percentage of your financial audits, performance audits, evaluations/inspections, investigations involve access to information problems?
Note: Figure data excludes the “no answer” responses. Numbers are rounded. The number of responses for each government group represents the combined responses for Questions 11, 19, 27, and 35. Details on the total number of respondents to each question by government group are in Appendix II. |
Figure 6 shows the percent of responses by function indicating access problems in more than 25 percent of reviews. For all functions, only 7 responses indicated having access problems in “All” reviews.
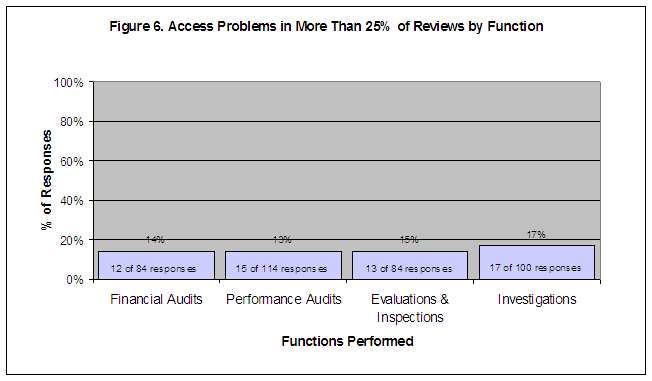
| Source: Survey responses to Questions 11, 19, 27, and 35: What percentage of your financial audits, performance audits, evaluations/inspections, investigations involve access to information problems?
Note: Figure data excludes the “no answer” responses. Numbers are rounded. Details on the total number of respondents to each question by government group are in Appendix II. |
TRENDS IN ACCESS PROBLEMS
Respondents’ Access Problems Have Generally Remained at the Same Level.
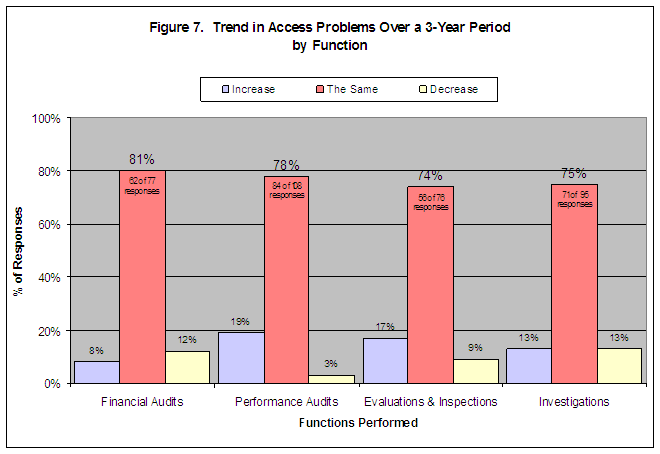
Most responses reported that the access to information trend over the last three years has remained about the same. About three-fourths of the responses indicated a stable trend in the ability to access information. Figure 7 shows the overall stable trend reported by respondents for each function.
| Source: Survey responses to Questions 14, 22, 30, and 38: Over the past 3 years, would you say that access to information problems on financial audits has increased, decreased, or remained the same? Performance audits? Evaluations/Inspections? Investigations?
Note: Figure data excludes the “no answer” responses. Numbers are rounded and may not add to 100 percent. Details on the total number of respondents to each question by government group are in Appendix II. |
State responses indicated a greater increase in access problems than federal and local responses. The state response rate for increased access problems was at least two times greater overall than the federal and local response rates. Figure 8 shows the percent of responses by government group indicating some increase in access problems.
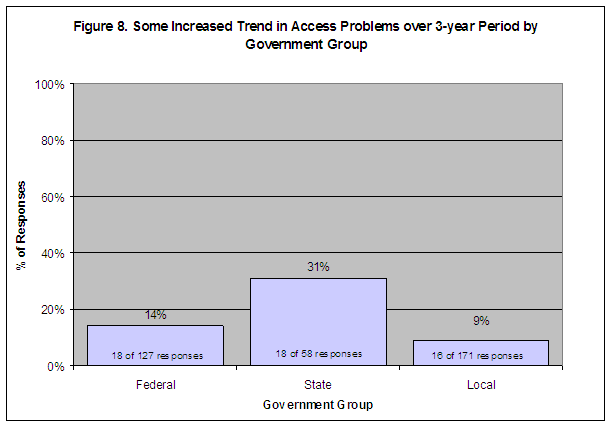
| Source: Survey responses to Questions 14, 22, 30, and 38: Over the past 3 years, would you say that access to information problems on financial audits has increased, decreased, or remained the same? Performance audits? Evaluations/Inspections? Investigations?
Note: Figure data excludes the “no answer” responses. Numbers are rounded. The number of responses for each government group represents the combined responses for Questions 14, 22, 30, and 38. Details on the total number of respondents to each question by government group are in Appendix II. |
The reported increases in access problems by function are shown in Figure 9.
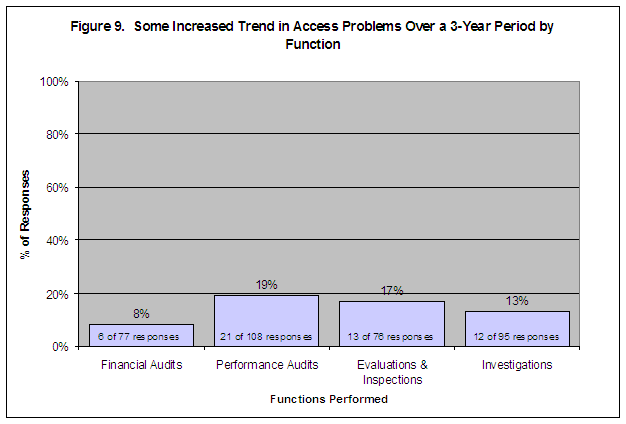
| Source: Survey responses to Questions 14, 22, 30, and 38: Over the past 3 years, would you say that access to information problems on financial audits has increased, decreased, or remained the same? Performance audits? Evaluations/Inspections? Investigations?
Note: Figure data excludes the “no answer” responses. Numbers are rounded. Details on the total number of respondents to each question by government group are in Appendix II. |
More federal responses indicated a decreasing trend in access problems than state and local responses. Figure 10 shows the percent of responses by government group indicating some decrease in access problems over a 3-year period.
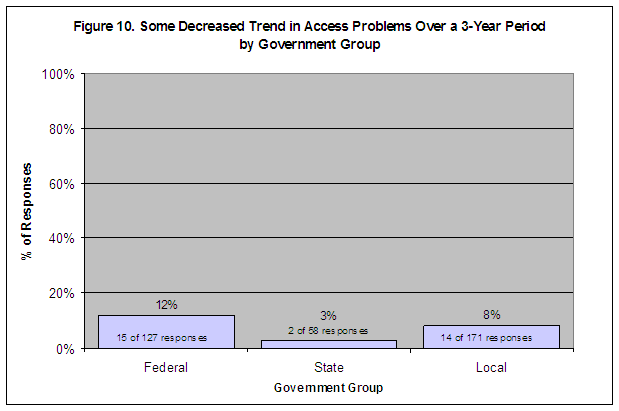
| Source: Survey responses to Questions 14, 22, 30, and 38: Over the past 3 years, would you say that access to information problems on financial audits has increased, decreased, or remained the same? Performance audits? Evaluations/Inspections? Investigations?
Note: Figure data excludes the “no answer” responses. Numbers are rounded. The number of responses for each government group represents the combined responses for Questions 14, 22, 30, 38. Details on the total number of respondents to each question by government group are in Appendix II. |
Figure 11 shows the percent of responses by function indicating some decrease in access problems over a 3-year period.
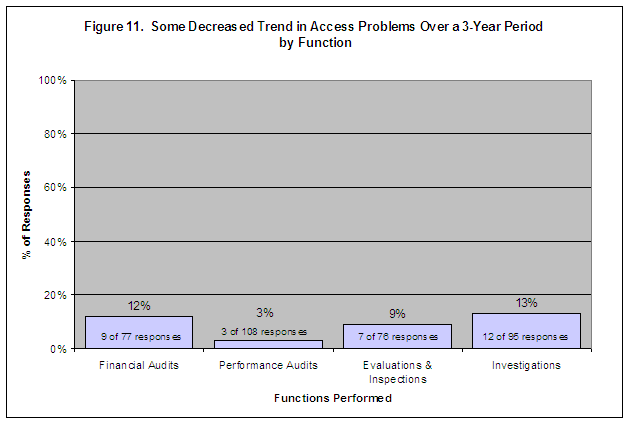
| Source: Survey responses to Questions 14, 22, 30, and 38: Over the past 3 years, would you say that access to information problems on financial audits has increased, decreased, or remained the same? Performance audits? Evaluations/Inspections? Investigations?
Note: Figure data excludes the “no answer” responses. Numbers are rounded. Details on the total number of respondents to each question by government group are in Appendix II. |
Respondents’ Satisfaction With Accessing Information is Generally High.
For the past 3-year period, almost two-thirds of responses indicated that organizations were “very satisfied” or “generally satisfied” with the trend in access to information. When comparing satisfaction rates by government group, there were no large differences among the federal, state, and local responses. Figure 12 shows the percent of responses by government group indicating satisfaction with the trend in access problems.
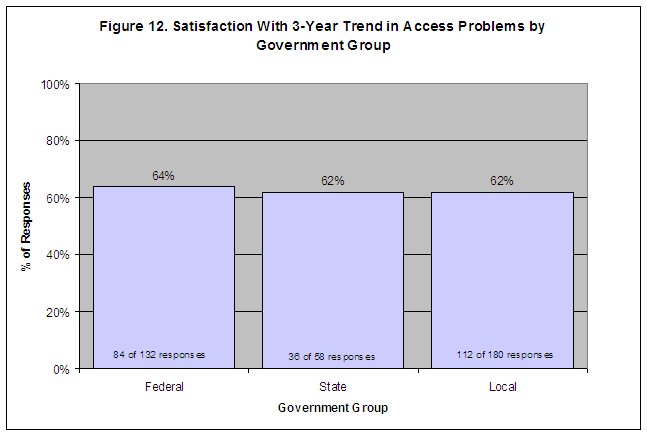
| Source: Survey responses for Questions 15, 23, 31, and 39: How satisfied or dissatisfied are you with the trend over the past 3 years with access to information for financial audits? Performance audits? Evaluations/Inspections? Investigations?
Note: Figure data excludes the “no answer” responses. Numbers are rounded. The number of responses for each government group represents the combined responses for Questions 15, 23, 31, and 39. Details on the total number of respondents to each question by government group are in Appendix II. |
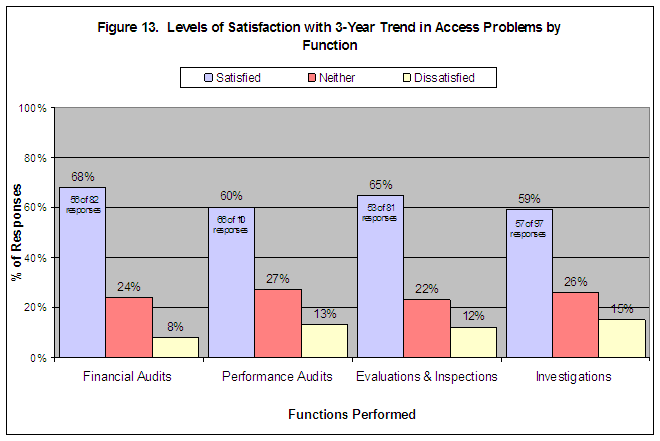
Figure 13 shows by function the percent of responses indicating the levels of satisfaction with the trend in access problems. More than 50 percent of the responses in each function indicated satisfaction with the
3-year trend.
| Source: Survey responses for Questions 15, 23, 31, and 39: How satisfied or dissatisfied are you with the trend over the past 3 years with access to information for financial audits? Performance audits? Evaluations/Inspections? Investigations?
Note: Figure data excludes the “no answer” responses. Numbers are rounded and may not add to 100 percent. Details on the total number of respondents to each question by government group are in Appendix II. |
For the “current” state of access to information, more than two-thirds of responses indicated “very satisfied” or “generally satisfied.” Figure 14 shows by government group the percent of responses indicating current satisfaction with accessing information.
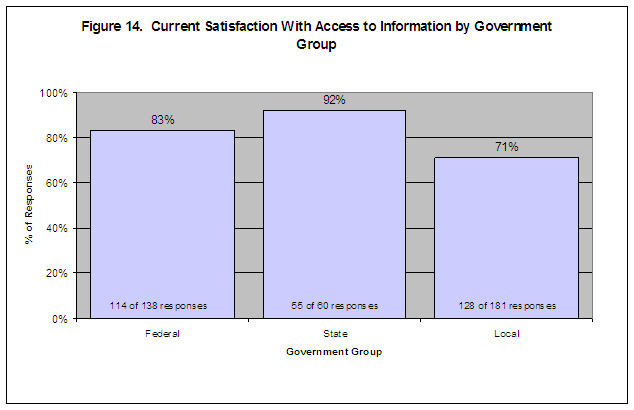
| Source: Survey responses to Questions 16, 24, 32, and 40: Currently, how satisfied or dissatisfied are you with your organization’s access to information on financial audits? Performance audits? Evaluations/Inspections? Investigations?
Note: Figure data excludes the “no answer” responses. Numbers are rounded. The number of responses for each government group represents the combined responses for Questions 16, 24, 32, and 40. Details on the total number of respondents to each question by government group are in Appendix II. |
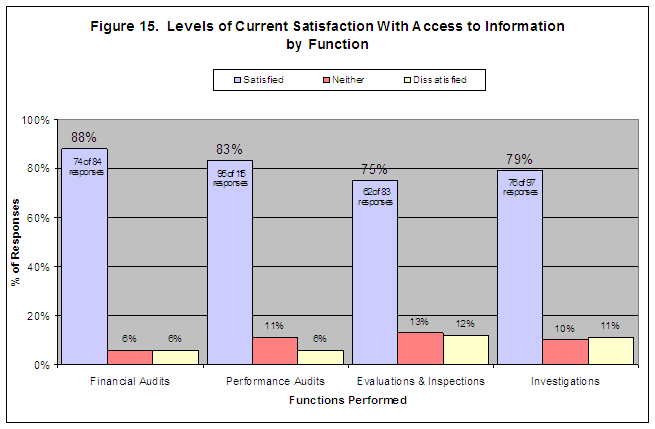
Figure 15 shows the percent of responses by function indicating the levels of current satisfaction with accessing information. At least 75 percent of the responses in each function indicated current satisfaction.
| Source: Survey responses to Questions 16, 24, 32, and 40: Currently, how satisfied or dissatisfied are you with your organization’s access to information on financial audits? Performance audits? Evaluations/Inspections? Investigations?
Note: Figure data excludes the “no answer” responses. Numbers are rounded and may not add to 100 percent. Details on the total number of respondents to each question by government group are in Appendix II. |
Some Respondents Indicated Dissatisfaction With the 3-Year Trend and Current State of Access.
Generally, less than 20 percent of the responses in each government group indicated dissatisfaction with the 3-year trend in access problems. Figure 16 shows the percent of responses by government group indicating dissatisfaction.
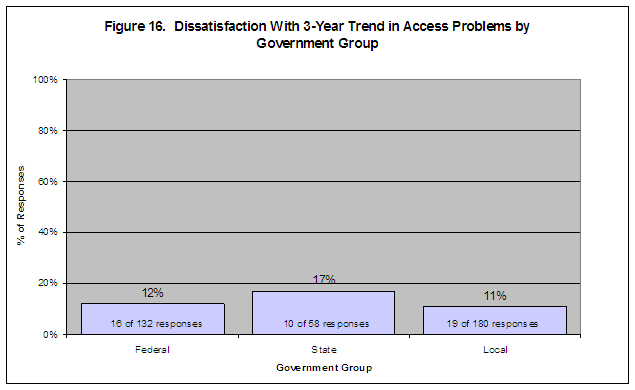
| Source: Survey responses for Questions 15, 23, 31, and 39: How satisfied or dissatisfied are you with the trend over the past 3 years with access to information for financial audits? Performance audits? Evaluations/Inspections? Investigations?
Note: Figure data excludes the “no answer” responses. Numbers are rounded. The number of responses for each government group represents the combined responses for Questions 15, 23, 31, and 39. Details on the total number of respondents to each question by government group are in Appendix II. |
Figure 17 shows the percent of responses by function indicating dissatisfaction with the 3-year trend in access problems.
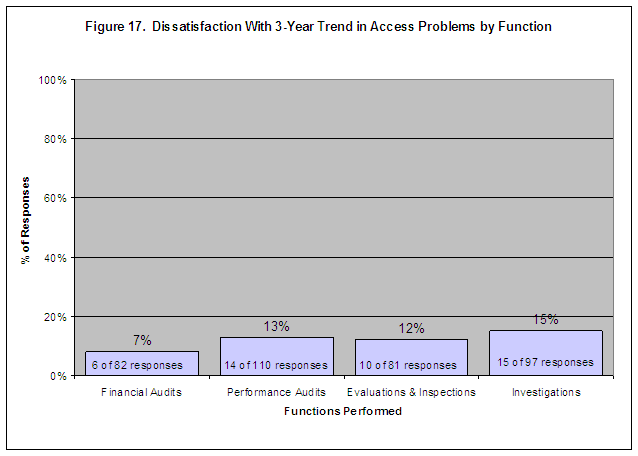
| Source: Survey responses for Questions 15, 23, 31, and 39: How satisfied or dissatisfied are you with the trend over the past 3 years with access to information for financial audits? Performance audits? Evaluations/Inspections? Investigations?
Note: Figure data excludes the “no answer” responses. Numbers are rounded. Details on the total number of respondents to each question by government group are in Appendix II. |
Overall, 11 percent or less of the responses in each government group indicated dissatisfaction with the “current” state of access to information. Figure 18 shows the percent of responses by government group indicating current dissatisfaction.
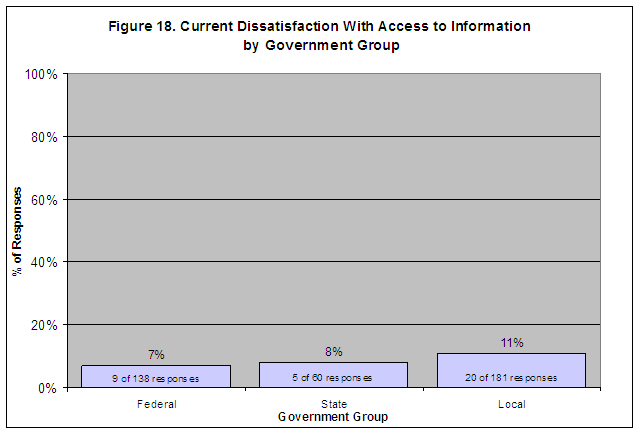
| Source: Survey responses to Questions 16, 24, 32, and 40: Currently, how satisfied or dissatisfied are you with your organization’s access to information on financial audits? Performance audits? Evaluations/Inspections? Investigations?
Note: Figure data excludes the “no answer” responses. Numbers are rounded. The number of responses for each government group represents the combined responses for Questions 16, 24, 32, and 40. Details on the total number of respondents to each question by government group are in Appendix II. |
Figure 19 shows by function the percent of responses indicating dissatisfaction with the current state of access.
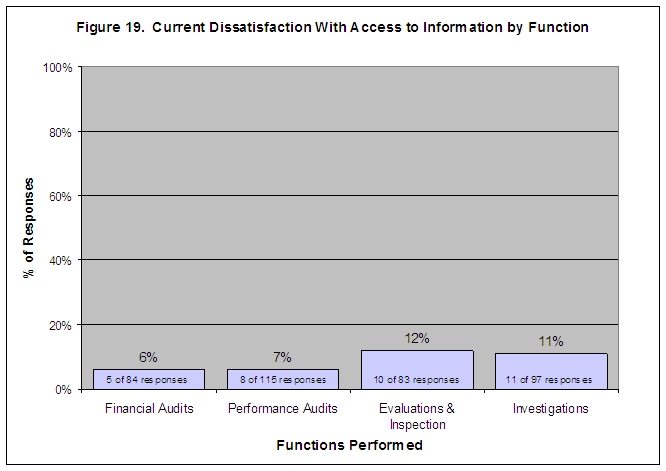
| Source: Survey responses to Questions 16, 24, 32, and 40: Currently, how satisfied or dissatisfied are you with your organization’s access to information on financial audits? Performance audits? Evaluations/Inspections? Investigations?
Note: Figure data excludes the “no answer” responses. Numbers are rounded. Details on the total number of respondents to each question by government group are in Appendix II. |
TYPES OF ACCESS PROBLEMS
Access Delays to Records and Unavailability/Uncooperativeness of Specific People Are More Common Problems for Respondents, but Denials of Records Are Not.
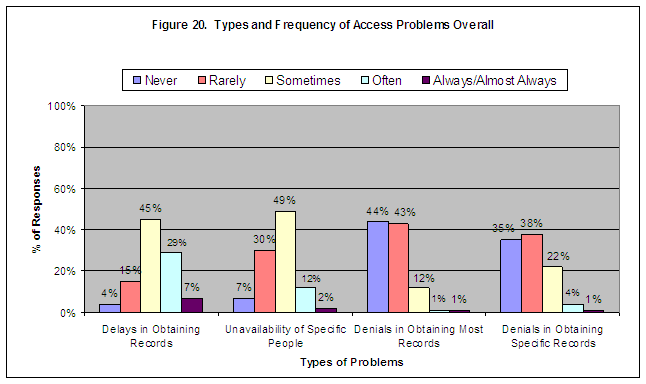
Despite the general satisfaction with access to information, many survey respondents faced problems with delays in obtaining information. Federal, state, and local respondents reported that they usually experience delays in obtaining access to records and to specific people. The combined response rate for “sometimes,” “often,” and “always/almost always” for delays in obtaining records in all functions was 81 percent (230 of 283 responses) and the combined response rate for unavailability/ uncooperativeness of specific people in all functions was 63 percent (175 of 277 responses).
Conversely, for denials of “most” or “specific” records, the majority of responses were “never” and “rarely.” The combined response rate of “never” and “rarely” for denials in obtaining most records in all functions was 87 percent (237 of 274 responses) and the combined response rate for denials in obtaining specific records in all functions was 73 percent (201 of 275 responses). Figure 20 shows the percent of responses indicating the frequency of each type of access problem encountered in all functions.
| Source: Survey responses to Questions 12, 20, 28, and 36: How often, if at all, are your access to information problems for financial audits, performance audits, evaluations/inspections, and investigations related to the following: a. delays in obtaining records, b. denials in obtaining most records, c. denials of specific records, or d. unavailability/uncooperativeness of specific people?
Note: Figure data excludes the “no answer” responses. Numbers are rounded and may not add to 100 percent. Details on the total number of respondents to each question by government group are in Appendix II. The 128 organizations that responded to this survey indicated that they perform one or more of the designated functions: financial audits, performance audits, evaluations and inspections, and investigations. The percentages in this figure are based on the combined responses for problems encountered in all the functions. |
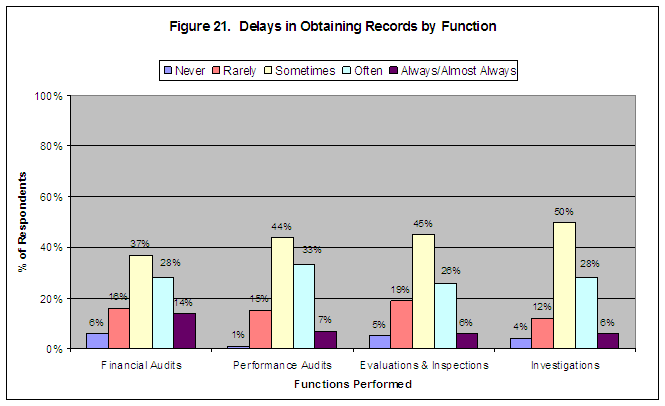
At least three-fourths of the survey responses reported that organizations experience delays in obtaining records while performing all four functions. For all four functions, responses indicated delays in obtaining records “sometimes,” “often,” or “always/almost always” as follows: financial audits 79 percent (40 of 51 responses), performance audits 84 percent (78 of 93 responses), evaluations and inspections 77 percent (50 of 65 responses), and investigations 84 percent (62 of 74 responses). Figure 21 shows the percent of responses indicating how often delays in obtaining records occur for each function.
| Source: Survey responses to Questions 12, 20, 28, and 36: How often, if at all, are your access to information problems for financial audits, performance audits, evaluations/inspections, and investigations related to the following: a. delays in obtaining records, b. denials in obtaining most records, c. denials of specific records, or d. unavailability/uncooperativeness of specific people?
Note: Figure data excludes the “no answer” responses. Numbers are rounded and may not add to 100 percent. Details on the total number of respondents to each question by government group are in Appendix II. |
-
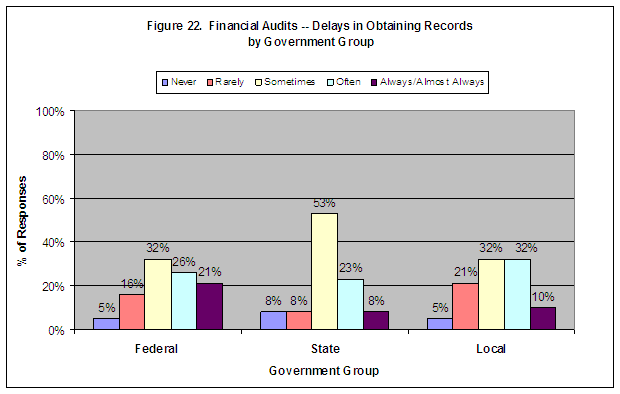
Financial Audits. There were no major differences among the federal, state, and local responses for delays in obtaining records for financial audits. The combined response rates for “sometimes,” “often,” and “always/almost always” are: federal 79 percent (15 of 19 responses), state 84 percent (11 of 13 responses), and local 74 percent (14 of 19 responses). Figure 22 shows the percent of responses by government group indicating how often delays in obtaining records occur for financial audits.
-
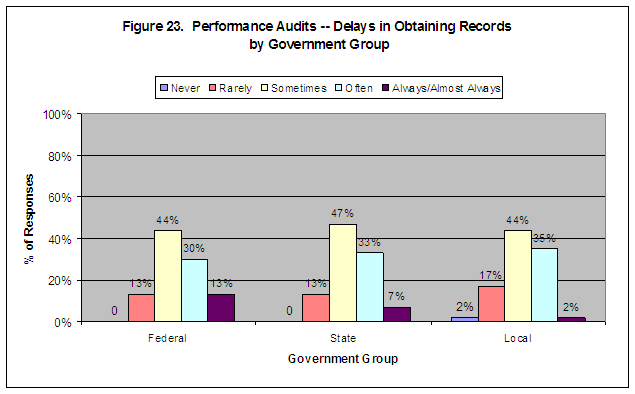
Performance Audits. There were no major differences among the federal, state, and local responses for delays in obtaining records for performance audits. The combined response rates for “sometimes,” “often,” and “always/almost always” are: federal 87 percent (26 of 30 responses), state 87 percent (13 of 15 responses), and local 81 percent (39 of 48 responses). Figure 23 shows the percent of responses by government group indicating how often delays in obtaining records occur for performance audits.
-
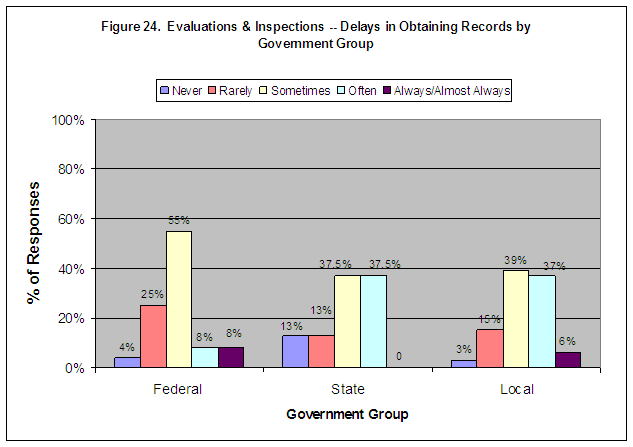
Evaluations/Inspections. There were no major differences among the federal, state, and local responses for delays in obtaining records for evaluations and inspections. The combined response rates for “sometimes,” “often,” and “always/almost always” are: federal 71 percent (17 of 24 responses), state 75 percent (6 of 8 responses), and local 82 percent (27 of 33 responses). Figure 24 shows the percent of responses by government group indicating how often delays in obtaining records occur for evaluations and inspections.
-
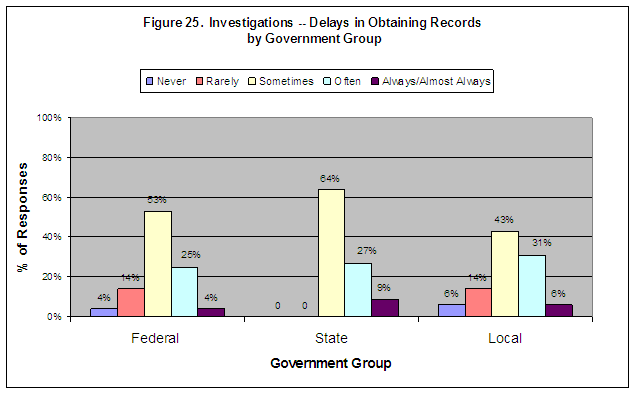
Investigations. The state responses reported the most problems in obtaining records for investigations. The combined response rates for “sometimes,” “often,” and “always/almost always” are: federal 82 percent (23 of 28 responses), state 100 percent (11 of 11 responses), and local 80 percent (28 of 35 responses). Figure 25 shows the percent of responses by government group indicating how often delays in obtaining records occur for investigations.
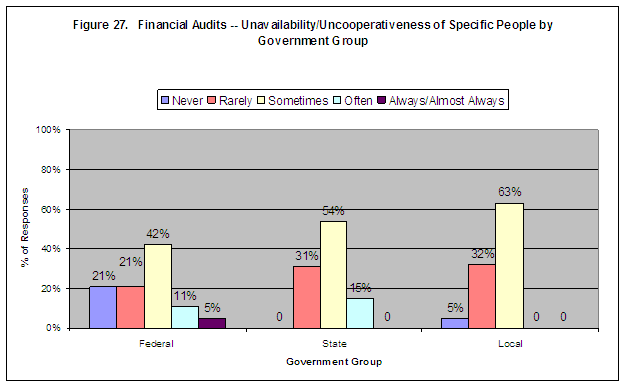
Financial Audits. The responses indicated that the unavailability/uncooperativeness of specific people during financial audits was a problem. The combined response rates for “sometimes,” “often,” and “always/almost always” are: federal 58 percent (11 of 19 responses), state 69 percent (9 of 13 responses), and local 63 percent (12 of 19 responses). Figure 27 shows the percent of responses by government group indicating how often unavailability/uncooperativeness of specific people occurs for financial audits.
-
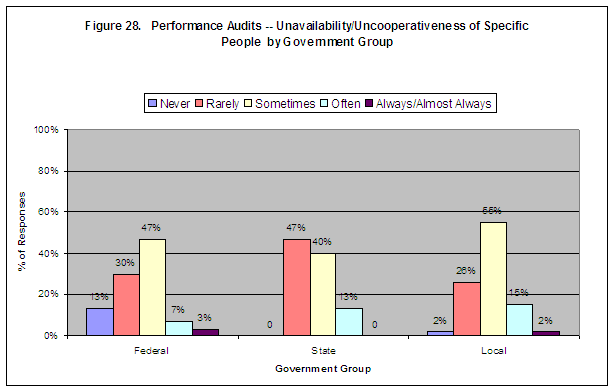
Performance Audits. Unavailability/uncooperativeness of specific people occurred more than half the time during performance audits. The local responses indicated a generally higher rate for this problem. The combined response rates for “sometimes,” “often,” and “always/almost always” are: federal 57 percent (17 of 30 responses), state 53 percent (8 of 15 responses), and local 72 percent (34 or 47 responses). Figure 28 shows the percent of responses by government group indicating how often unavailability/uncooperativeness of specific people occurs for performance audits.
-
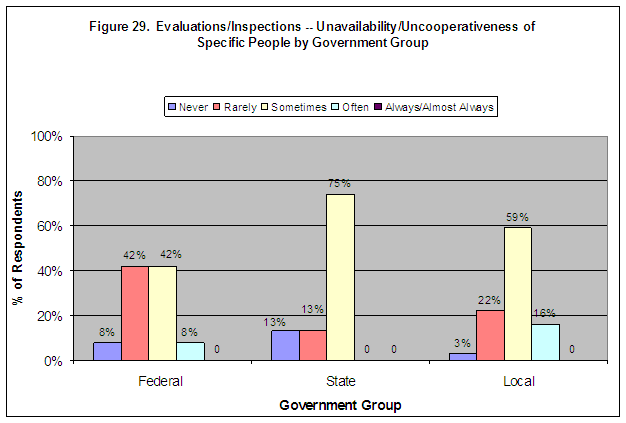
Evaluations/Inspections. The responses reported that the unavailability/uncooperativeness of specific people was a problem “sometimes” or “often”: federal 50 percent (12 of 24 responses), state 75 percent (6 of 8 responses), and local 75 percent (24 of 32 responses). None of the responses reported this problem “always/almost always.” Figure 29 shows the percent of responses by government group indicating how often unavailability/ uncooperativeness of specific people occurs for evaluations and inspections.
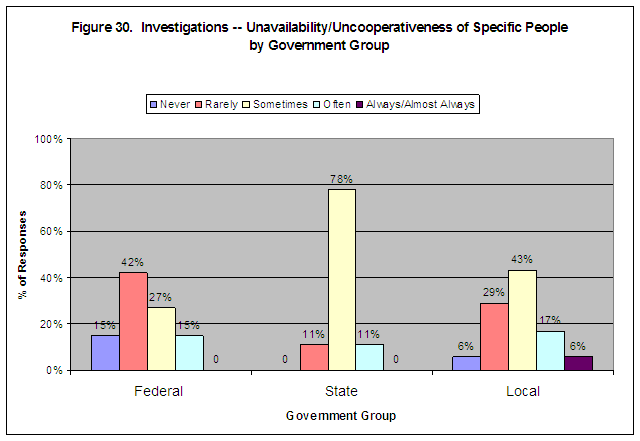
Investigations. There is a greater difference among the respondents performing investigations regarding problems with the unavailability/uncooperativeness of specific people. The combined response rates for “sometimes,” “often,” and “always/almost always” are: federal 42 percent (11 of 26 responses), state 89 percent (8 of 9 responses), and local 66 percent (23 of 35 responses). Figure 30 shows the percent of responses by government group indicating how often unavailability/ uncooperativeness of specific people occurs for investigations.
| Source: Survey responses for Question 12: How often, if at all, are your access to information problems for financial audits related to the following: a. delays in obtaining records, b. denials in obtaining most records, c. denials of specific records, or d. unavailability/uncooperativeness of specific people?
Note: Figure data excludes the “no answer” responses. Numbers are rounded and may not add to 100 percent. Details on the total number of respondents to each answer choice by government group are in Appendix II. |
| Source: Survey responses for Question 20: How often, if at all, are your access to information problems for performance audits related to the following: a. delays in obtaining records, b. denials in obtaining most records, c. denials of specific records, or d. unavailability/uncooperativeness of specific people?
Note: Figure data excludes the “no answer” responses. Numbers are rounded and may not add to 100 percent. Details on the total number of respondents to each answer choice by government group are in Appendix II. |
| Source: Survey responses for Question 28: How often, if at all, are your access to information problems for evaluations/inspections related to the following: a. delays in obtaining records, b. denials in obtaining most records, c. denials of specific records, or d. unavailability/uncooperativeness of specific people?
Note: Figure data excludes the “no answer” responses. Numbers are rounded and may not add to 100 percent. Details on the total number of respondents to each answer choice by government group are in Appendix II. |
| Source: Survey responses for Question 36: How often, if at all, are your access to information problems for investigations related to the following: a. delays in obtaining records, b. denials in obtaining most records, c. denials of specific records, or d. unavailability/uncooperativeness of specific people?
Note: Figure data excludes the “no answer” responses. Numbers are rounded and may not add to 100 percent. Details on the total number of respondents to each answer choice by government group are in Appendix II. |
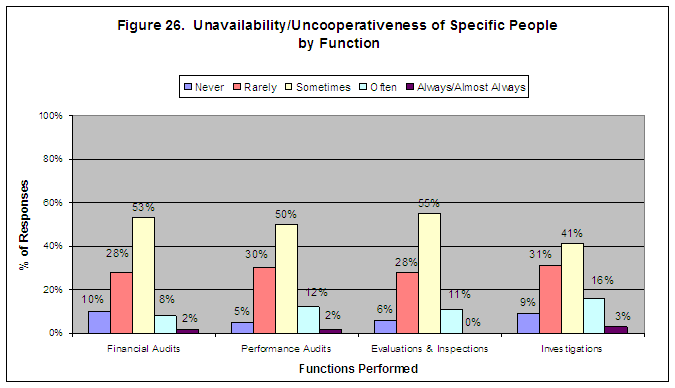
Many responses reported problems with gaining access to specific people while performing all four functions. For all four functions, responses indicated the unavailability/uncooperativeness of specific people “sometimes,” “often,” or “always/almost always” as follows: financial audits 63 percent (32 of 51 responses), performance audits 64 percent (59 of 92 responses), evaluations and inspections 66 percent (42 of 64 responses), and investigations 60 percent (42 of 70 responses). Figure 26 shows the percent of responses by function indicating how often unavailability/ uncooperativeness of specific people occurs.
| Source: Survey responses to Questions 12, 20, 28, and 36: How often, if at all, are your access to information problems for financial audits, performance audits, evaluations/inspections, and investigations related to the following: a. delays in obtaining records, b. denials in obtaining most records, c. denials of specific records, or d. unavailability/uncooperativeness of specific people?
Note: Figure data excludes the “no answer” responses. Numbers are rounded and may not add to 100 percent. Details on the total number of respondents to each question by government group are in Appendix II. |
| Source: Survey responses to Question 12: How often, if at all, are your access to information problems for financial audits related to the following: a. delays in obtaining records, b. denials in obtaining most records, c. denials of specific records, or d. unavailability/uncooperativeness of specific people?
Note: Figure data excludes the “no answer” responses. Numbers are rounded and may not add to 100 percent. Details on the total number of respondents to each answer choice by government group are in Appendix II. |
| Source: Survey responses to Question 20: How often, if at all, are your access to information problems for performance audits related to the following: a. delays in obtaining records, b. denials in obtaining most records, c. denials of specific records, or d. unavailability/uncooperativeness of specific people?
Note: Figure data excludes the “no answer” responses. Numbers are rounded and may not add to 100 percent. Details on the total number of respondents to each answer choice by government group are in Appendix II. |
| Source: Survey responses to Question 28: How often, if at all, are your access to information problems for evaluations/inspections related to the following: a. delays in obtaining records, b. denials in obtaining most records, c. denials of specific records, or d. unavailability/uncooperativeness of specific people?
Note: Figure data excludes the “no answer” responses. Numbers are rounded and may not add to 100 percent. Details on the total number of respondents to each answer choice by government group are in Appendix II. |
| Source: Survey responses to Question 36: How often, if at all, are your access to information problems for investigations related to the following: a. delays in obtaining records, b. denials in obtaining most records, c. denials of specific records, or d. unavailability/uncooperativeness of specific people?
Note: Figure data excludes the “no answer” responses. Numbers are rounded and may not add to 100 percent. Details on the total number of respondents to each answer choice by government group are in Appendix II. |
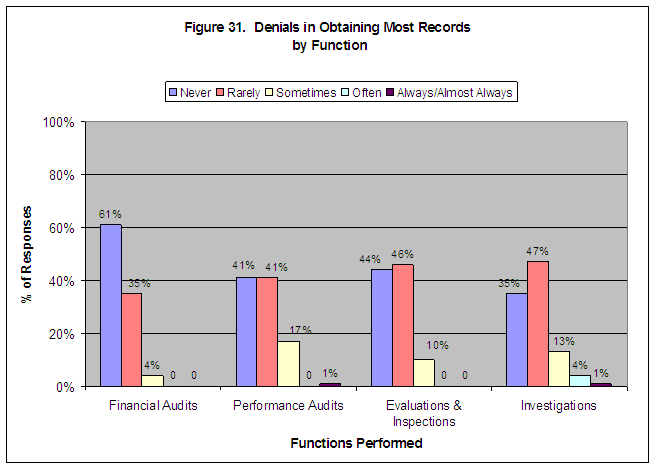
Denials in obtaining “most” records are not common access problems for respondents. A preponderance of the responses reported “never” or “rarely” experiencing denials in obtaining most records for each function performed: financial audits 96 percent (49 of 51 responses), performance audits 82 percent (72 of 88 responses), evaluations and inspections 90 percent (57 of 63 responses), and investigations 82 percent (59 of 72 responses). Figure 31 shows the percent of responses by function indicating how often denials in obtaining most records occurs.
| Source: Survey responses to Questions 12, 20, 28, and 36: How often, if at all, are your access to information problems for financial audits, performance audits, evaluations/inspections, and investigations related to the following: a. delays in obtaining records, b. denials in obtaining most records, c. denials of specific records, or d. unavailability/uncooperativeness of specific people?
Note: Figure data excludes the “no answer” responses. Numbers are rounded and may not add to 100 percent. Details on the total number of respondents to each question by government group are in Appendix II. |
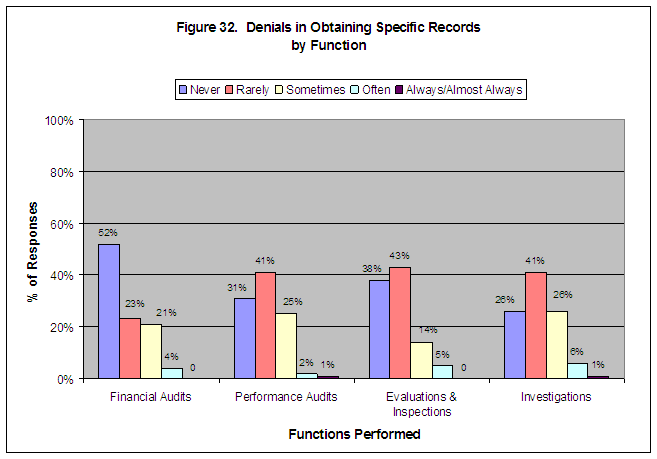
Denials in obtaining “specific” records are not common access problems for respondents. More than two-thirds of the responses reported “never” or “rarely” experiencing denials in obtaining specific records for each function performed: financial audits 75 percent (39 of 52 responses), performance audits 72 percent (63 of 88 responses), evaluations and inspections 81 percent (51 of 63 responses), and investigations 67 percent (48 of 72 responses). Figure 32 shows the percent of responses by function indicating how often denials in obtaining specific records occurs.
| Source: Survey responses to Questions 12, 20, 28, and 36: How often, if at all, are your access to information problems for financial audits, performance audits, evaluations/inspections, and investigations related to the following: a. delays in obtaining records, b. denials in obtaining most records, c. denials of specific records, or d. unavailability/uncooperativeness of specific people?
Note: Figure data excludes the “no answer” responses. Numbers are rounded and may not add to 100 percent. Details on the total number of respondents to each question by government group are in Appendix II. |
FACTORS INHIBITING ACCESS TO INFORMATION
Most Respondents Did Not Consider Any Specific Factor as Playing a “Major or Very Major” Role in Inhibiting Access to Information.
The survey respondents identified the extent that certain factors play in inhibiting access to information by selecting multiple choice responses and by providing narrative comments.
Multiple Choice (Closed-ended) Responses. Table 2 presents the percentage of respondents who indicated the extent that each factor played in their accountability organizations’ access to information problems (major or very major role, some role or minor role, or no role). The inhibiting factors are listed from high to low based on the ratings given by respondents for the answer choices “major role” or “very major role.”
Of the 12 factors presented to the respondents in the survey, only one, “d. management was slow to respond,” was rated much higher (25 percent) than the others as a “major or very major” concern. Of the factors that played “some role or a minor role,” respondents selected four factors more often: “e. privacy/confidentiality” (64 percent), “b. insufficient personnel” (63 percent), “c. too much work” (61 percent), and “d. management slow to respond” (60 percent). A considerable percentage of responses indicated that the following factors played “no role” in access to information problems: “k. improperly formatted requests” (77 percent),
“a. insufficient funds” (75 percent), and “j. ambiguous request” (64 percent).
Table 2. Factors Inhibiting Access to Information
(as a Percent of Respondents)
| Inhibiting Factors
(Factors are lettered as they appear in the survey) |
Major Role or Very Major Role % |
Some Role or Minor Role % |
No Role % |
|---|---|---|---|
d. The other organization’s management took too long to respond to requests for information. |
25%
|
60% |
15% |
e. The other organization had privacy/confidentiality concerns. |
15% |
64% |
21% |
b. The other organizations said that it had insufficient personnel to satisfy your requests Insufficient Personnel. |
11% |
63% |
26% |
c. The other organization said it already had too much work to satisfy your request. |
11% |
61% |
28% |
h. The other organization questioned the legal authority for the request. |
10% |
54% |
36% |
l. The other organization was concerned about the public issuance of the information in the final report. |
11% |
58% |
31% |
i. The other organization had limited experience with your organization. |
9% |
55% |
36% |
f. The other organization had concerns about security and safekeeping. |
6% |
54% |
40% |
g. The other organization did not understand the importance of the request. |
3% |
59% |
38% |
a. The other organizations said that it had insufficient funds to satisfy your requests. |
1% |
24% |
75% |
j. The other organization indicated that the request for information was ambiguous. |
1% |
35% |
64% |
k. The other organization indicated that the request for information was not in the appropriate format. |
0% |
23% |
77% |
| Source: Survey responses to Question 41: Considering the financial audits, performance audits, evaluations/inspections, and investigations that your organization conducts, how much of a role did the following factors play in inhibiting your organization’s ability to access information?
Note: Table data excludes the “no answer” responses. Numbers are rounded and may not add to 100 percent. The total number of responses to Question 41 ranged between 121 and 125 for each of the 12 factors. Details on the total number of respondents to each answer choice by government group are in Appendix II. |
Narrative (Open-ended) Comments. In their written comments, some respondents provided additional inhibiting factors that they encountered when requesting information. These factors and issues included:
The other organization indicated that it did not have time to respond to the information request.
The other organization said the request for information was outside the scope of the review.
The other organization said providing the information would result in being “blamed” for negative findings.
The other organization could not provide the requested information because of incompatible data systems.
Some respondents also provided comments about unique access issues that they have encountered because of the subject matter of their accountability reviews. The unique issues included:
Lack of interagency cooperation when the review subject and data requirements cross Department lines covered by different accountability organizations.
Grantees making broad claims of attorney-client privilege to delay or deny access to records.
Difficulty obtaining information from third parties that do not have a direct contractual relationship with the government.
The variety and sometimes confusing legal restrictions on accessing information such as the “Privacy Act, Freedom of Information Act, Grand Jury, Qui Tam, and Health Insurance Portability and Accountability Act.”
Unlike the factors in Table 2, in their comments, respondents did not indicate how major or minor of a role these factors and unique issues played in inhibiting their organizations ability to access information.
Legal Authority as a Helpful or Hindering Factor in Access Problems. The survey also asked respondents about their satisfaction with their legal authority, how often other access problems had their source in legal
Characteristics of Legal Authority Source: All of the federal and most of the state accountability organizations perform their review functions based on legal authority derived from legislation. About two-thirds of the local organizations obtain their legal authority from legislation. The remainder of the authority comes from regulation, executive order or directive, county or city charters, state constitutions, or other government authority. Subpoenas: Slightly more than half of the respondents have the legal authority to subpoena records. A substantial majority of the federal and state organizations, 92 percent and 68 percent, respectively, have this authority compared to only 21 percent for the local entities. |
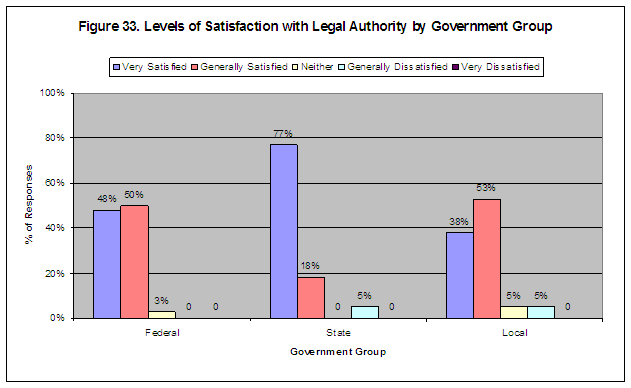
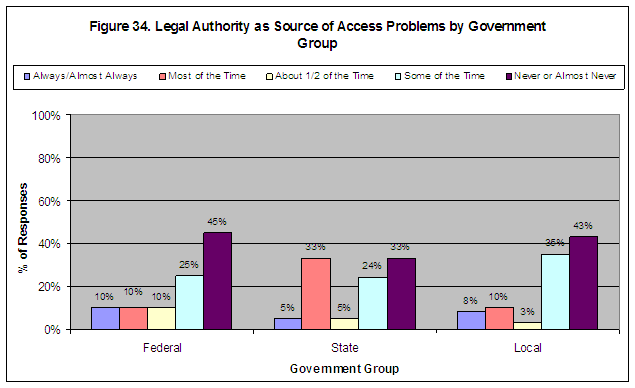
Although satisfaction was high with legal authority, in over half of the responses, access to information problems arose from questions regarding legal authority. The state responses showed a greater degree of access problems from legal authority concerns “most of the time” (33 percent, 7 of 21 responses) compared to the federal responses (10 percent, 4 of 40 responses), and the local responses (10 percent, 6 of 60 responses) for this answer choice. Overall, at least one-third of the responses in each government group (federal 18 of 40 responses, state 7 of 21 responses, and local 26 of 60 responses) indicated that legal authority was “never or almost never” a problem. Figure 34 shows the percent of responses by government group indicating the frequency of access problems from legal authority.
| Source: Survey responses to Question 4: How satisfied or dissatisfied are you with your organization’s legal authority to access information? Note: Figure data excludes the “no answer” responses. Numbers are rounded and may not add to 100 percent. Details on the total number of respondents to each answer choice by government group are in Appendix II. |
| Source: Survey responses to Question 5: In your opinion, when you have access to information problems, how often (if at all) are those problems attributable to disagreements over your organization’s legal right to access the information requested?
Note: Figure data excludes the “no answer” responses. Numbers are rounded and may not add to 100 percent. Details on the total number of respondents to each answer choice by government group are in Appendix II. |
To alleviate the potential access to information problems arising from questions regarding legal authority, some survey respondents indicated in their narrative comments that the following additional legal authorities would be helpful:
Clarification of accountability organizations’ right of access,
Clear mandate for auditees to cooperate,
Full law enforcement authority,
Ability to subpoena tangible items such as electronic hardware,
Standard access rules in all programs,
Ability to conduct data mining more easily to detect fraud, waste, and abuse,
State law for accessing financial accounting records, and
Access to any financial activity that occurs within the county.
STRATEGIES USED TO ACCESS INFORMATION
Respondents Report That They Resolve Most Access to Information Problems Through a Variety of Strategies. Addressing Problems Early, Encouraging Cooperation, Communicating Frequently, and Protecting Sensitive Information Were Among the Most Successful Strategies Cited.
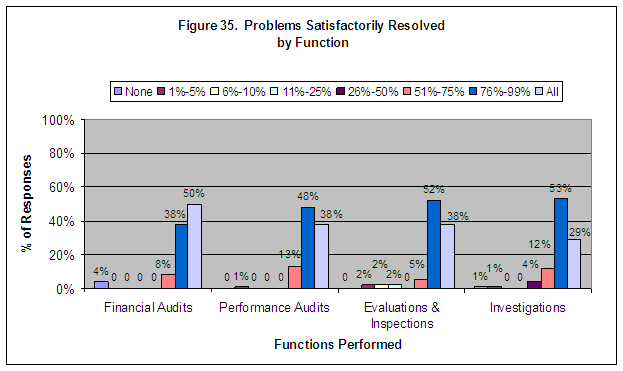
Satisfactory resolution of access problems occurs most of the time for respondents. With few exceptions, respondents reported successful resolution of access problems in 51 percent or more of their reviews (“51% to All” answer choices). The combined response rates for satisfactory resolution in “51% to All” reviews are: financial audits 96 percent (50 of 52 responses), performance audits 99 percent (92 of 93 responses), evaluations and inspections 95 percent (60 of 63 responses), and investigations 94 percent (71 of 76 responses). At least one-fourth of the responses (107 of 284) indicated that problems were resolved in “All” reviews performed in each function. Figure 35 shows the percent of responses indicating satisfactorily resolved access problems for each function.
| Source: Survey responses to Questions 13, 21, 29, and 37: What percentage of your financial audits that have access to information problems are satisfactorily resolved (complete and timely)? Performance audits? Evaluations and inspections? Investigations?
Note: Figure data excludes the “no answer” responses. Numbers are rounded and may not add to 100 percent. Details on the total number of respondents to each question by government group are in Appendix II. |
-
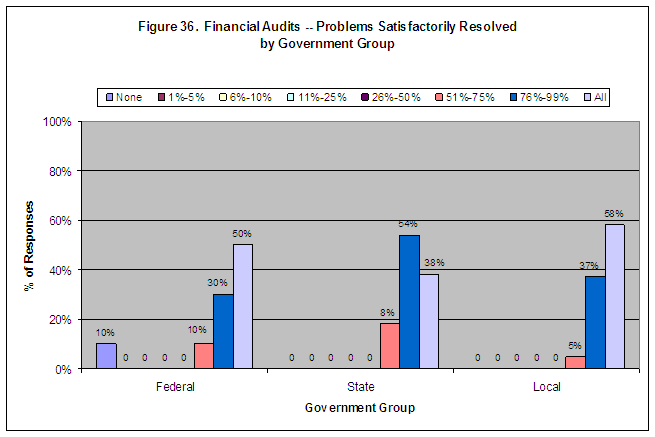
Financial Audits. Respondents stated that they usually resolved access problems in 51 percent or more of their financial audits. The combined response rates for the three answer choices encompassing “51% to All” are: federal 90 percent (18 of 20 responses), state 100 percent (13 of 13 responses), and local 100 percent (19 of 19 responses). However, 10 percent of the federal responses (2 of 20) indicated that access to information problems could not be resolved. Figure 36 shows the percent of responses by government group indicating how often access problems are resolved for financial audits.
-
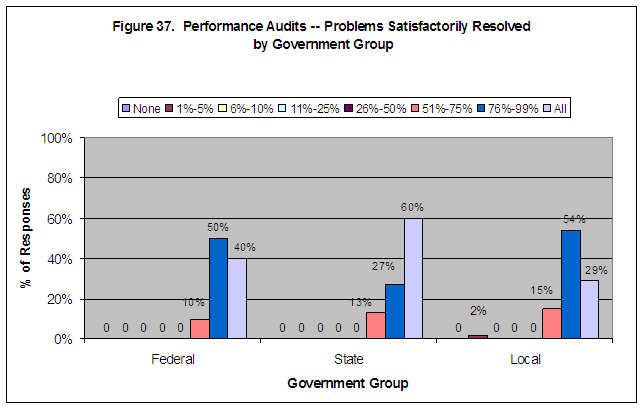
Performance Audits. Respondents stated that they usually resolved access problems in 51 percent or more of their performance audits. The combined response rates for the three answer choices encompassing “51% to All” are: federal 100 percent (30 of 30 responses), state 100 percent (15 of 15 responses), and local 98 percent (47 of 48 responses). Figure 37 shows the percent of responses by government group indicating how often access problems are resolved for performance audits.
-
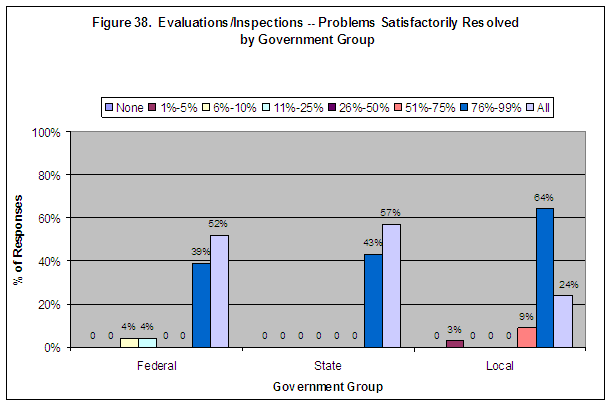
Evaluations/Inspections. Respondents stated that they usually resolved access problems in 51 percent or more of their evaluations and inspections. The combined response rates for the three answer choices encompassing “51% to All” are: federal 91 percent (21 of 23 responses), state 100 percent (7 of 7 responses), and local 97 percent (32 of 33 responses). Figure 38 shows the percent of responses by government group indicating how often access problems are resolved for evaluations and inspections.
-
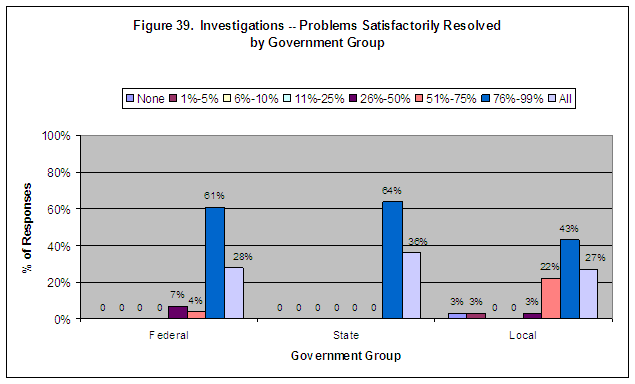
Investigations. Respondents stated that they usually resolved access problems in 51 percent or more of their investigations. The combined response rates for the three answer choices encompassing “51% to All” are: federal 93 percent (26 of 28 responses), state 100 percent (11 of 11 responses), and local 92 percent (34 of 37 responses). Figure 39 shows the percent of responses by government group indicating how often access problems are resolved for investigations.
| Source: Survey responses to Question 13: What percentage of your financial audits that have access to information problems are satisfactorily resolved (complete and timely)?
Note: Figure data excludes the “no answer” responses. Numbers are rounded and may not add to 100 percent. Numbers are rounded and may not add to 100 percent. Details on the total number of respondents to each answer choice by government group are in Appendix II. |
| Source: Survey responses to Question 21: What percentage of your performance audits that have access to information problems are satisfactorily resolved (complete and timely)?
Note: Figure data excludes the “no answer” responses. Numbers are rounded and may not add to 100 percent. Details on the total number of respondents to each answer choice by government group are in Appendix II. |
| Source: Survey responses to Question 29: What percentage of your evaluations/inspections that have access to information problems are satisfactorily resolved (complete and timely)?
Note: Figure data excludes the “no answer” responses. Numbers are rounded and may not add to 100 percent. Details on the total number of respondents to each answer choice by government group are in Appendix II. |
| Source: Survey responses to Question 37: What percentage of your investigations that have access to information problems are satisfactorily resolved (complete and timely)?
Note: Figure data excludes the “no answer” responses. Numbers are rounded and may not add to 100 percent. Details on the total number of respondents to each answer choice by government group are in Appendix II. |
Several strategies are useful in resolving access problems. We asked respondents to identify the strategies that helped them gain access to information through multiple choice (closed-ended) responses and narrative (open-ended) comments.
-
Multiple Choice (Closed-ended) Responses. Each of the multiple choice responses refers to a potential strategy or action that may have been used by the respondents to promote access to information and avoid problems. Table 3 presents the percent of responses indicating the extent that each strategy played in the respondent organization’s resolution of access to information problems (very useful/moderately useful, somewhat/a little useful, not useful, and never tried). The strategies are listed from high to low based on the ratings given by respondents for the answer choices “very useful” or “moderately useful.”
-
Open-Ended Questions. Our open-ended questions encouraged respondents to explain in their own words the strategies that they used to promote access to information and avoid problems, and to describe the degree to which they obtained satisfactory results by using these strategies. The majority of the strategies submitted by survey respondents for addressing access issues are common sense approaches that are used routinely in conducting accountability work. These common approaches are:
-
Meeting with managers from the organization undergoing review to discuss the review objectives and data requirements, reinforce legislative or regulatory authority to access the data, and explain polices and procedures for conducting reviews.
-
Issuing written communication such as project initiation letters that explain review objectives and data requirements and state managers’ responsibilities to comply with data requests.
- Providing examples of acceptable documentation.
- Having persons knowledgeable of information technology work with the organization undergoing review to facilitate extracting automated data.
- Developing joint guidelines with organizations undergoing review to protect information from third party access.
- Emphasizing that the improvements made by the organization undergoing review will be included in the report.
- Assuring the organization that sensitive information will be protected in workpapers.
- Using a court order to obtain records.
- Revising business cards to include the citation for the accountability organization’s legal authority.
- Requiring department heads involved in a project to attend the entrance conference.
- Ensuring that the organization will have the opportunity to review the draft report for sensitive information that should not be released to the public.
Table 3. Ratings of Strategies for Resolving Access Problems
(as % of Responses)
| Strategies
(Strategies are lettered as they appear in the survey) |
Very Useful or Moderately Useful % |
Somewhat or a Little Useful % |
Not Useful % |
Not Tried % |
|---|---|---|---|---|
e. Addressing issues early in the process to avoid access issues before they occur. |
67% |
26% |
2% |
5% |
a. Encouraging the other organization’s management to support providing access to information. |
58% |
34% |
2% |
6% |
h. Communicating frequently with other organizations to explain your missions, authority, and information requirements. |
57% |
35% |
0% |
8% |
g. Having policies and procedures to address the privacy/confidentiality concerns of other organization’s information. |
52% |
36% |
2% |
10% |
i. Sanitizing your reports to protect sensitive information. |
52% |
32% |
3% |
14% |
f. Having policies and procedures to address concerns about security and safekeeping of other organization’s information. |
51% |
33% |
2% |
14% |
d. Revising policies and procedures regarding access to information to improve efficiency and effectiveness. |
26% |
36% |
3% |
35% |
c. Receiving technical and procedural training to help with access to information concerns. |
21% |
43% |
4% |
32% |
b. Receiving interpersonal training to help with access to information concerns. |
9% |
38% |
5% |
48% |
| Source: Survey responses to Question 42: Considering the financial audits, performance audits, evaluations/inspections, and investigations that your organization conducts, how useful have the following strategies been in helping your organization to access information?
Note: Table data excludes the “no answer” responses. Numbers are rounded and may not add to 100 percent. The total number of responses to Question 42 ranged between 117 and 122 for each of the 9 strategies. Details on the total number of respondents to each answer choice by government group are in Appendix II. |
Of the nine strategies for addressing access problems presented to the respondents, “e. addressing issues early in the process” was rated higher than the other eight, with 67 percent of the responses reporting that this strategy was “very useful or moderately useful.” Communication efforts such as “a. encouraging management to support access” and “h. communicating frequently with other organizations” also were reported to be “very useful or moderately useful,” with ratings of 58 percent and 57 percent, respectively. Over 50 percent of the responses also rated “g. policy and procedures for privacy and confidentiality,” “i. sanitizing reports to protect sensitive information”, and “f. policy and procedures for security and safekeeping” as “very useful or moderately useful” in addressing access problems. These three strategies are of particular interest because responses rated “the other organization had privacy/confidentiality concerns” as the second most serious factor playing a major role or very major role in access problems (see Table 2).
Respondents stated that the meetings and written communications resulted in successful outcomes most of the time.
For this report, we selected those strategies that described actions that appeared somewhat beyond the routine approaches to access problems and that could potentially have widespread applicability.
Selected Strategies |
Each strategy is described in more detail on the following pages and is presented in five parts: the problem or issue, the strategy implemented, the outcome achieved, the resources required for implementation, and obstacles or concerns that were encountered.
FEDERAL RESPONDENTS PROVIDED EXAMPLES OF
THREE USEFUL STRATEGIES
|
Federal Example 1
|
Federal Example 2
|
FEDERAL RESPONDENTS PROVIDED EXAMPLES OF
THREE USEFUL STRATEGIES
|
Federal Example 3
|
STATE RESPONDENTS PROVIDED AN EXAMPLE OF
ONE USEFUL STRATEGY
|
State Example
Our overall goal in conducting any performance audit is to improve public accountability, which is fundamental for all of us who serve the public interest. We can assure you that, while maintaining our independence, we will seek to achieve our goal through cooperation with you and your staff. If our audit work results in positive findings, we will report them, just as we report findings that are less than positive. Regarding the latter, our performance auditors will use a “constructive engagement” audit approach whereby we work with you during the audit to facilitate improvements on a real-time basis. Subsequently, when we write our report, we will include verifiable improvements that you made during our field work, as appropriate. A final report will be made available to the public only when you have had an opportunity to review it and provide your comments. |
LOCAL RESPONDENTS PROVIDED EXAMPLES OF
FIVE USEFUL STRATEGIES
|
Local Example 1
|
Local Example 2
|
LOCAL RESPONDENTS PROVIDED EXAMPLES
OF FIVE USEFUL STRATEGIES
|
Local Example 3
|
Local Example 4
|
LOCAL RESPONDENTS PROVIDED EXAMPLES OF
FIVE USEFUL STRATEGIES
|
Local Example 5
|
