Our objectives were to: (1) review CALEA implementation costs and progress; (2) review the impediments to CALEA implementation, including the effects of emerging technologies; and (3) determine how the implementation of CALEA, or lack thereof, has impacted federal, state, and local law enforcement in their ability to conduct electronic surveillance. We conducted our audit in accordance with the Government Auditing Standards and included such tests as were considered necessary to accomplish our objectives. Our audit covered the implementation of CALEA since its inception.
As part of our audit, we obtained an understanding of CALEA and its history by reviewing the Communications Assistance for Law Enforcement Act (P.L. 103-414; 47 USC § 1001 et. seq.) and the major judicial and legislative actions that preceded CALEA including Berger v. New York, 388 S.Ct. 1873 (1967), Katz v. United States, 88 S.Ct. 507 (1967), and the Electronics Communication Privacy Act. Additionally, we reviewed the FCC actions related to CALEA including their Notice of Proposed Rulemaking and Declaratory Ruling (NPRM) and select comments to the NPRM from interested parties. To assess the FBI’s strategy for implementing CALEA, we reviewed the FBI’s Strategic Plan 2004-2009, the CIU’s Program Plan FY 2004-FY 2008 and documentation pertaining to the Right-to-Use software negotiations.
We analyzed data provided in the FBI’s Flexible Deployment Initiatives to assess the FBI’s methodology in estimating CALEA compliance. In addition, we reviewed the FBI Investigative Technology Division CALEA Law Enforcement Case Examples, the Criminal Division’s examples of intercept problems, and the FBI's 2004 Threat Assessment Report, with the corresponding individual survey responses, to gain an understanding of issues encountered by law enforcement while conducting electronic surveillance.
We conducted interviews with various officials from the FBI’s Investigative Technology Division, including the Deputy Assistant Director; the Section Chief, Electronic Surveillance Technology Section; the Unit Chief, CALEA Implementation Unit; and the FBI and DEA Supervisory Special Agents for CALEA Implementation. We also conducted interviews with various officials from the DEA, including the Assistant Administrator, Operational Support Division; the Deputy Assistant Administrator, Office of Investigative Technology; the Chief, Telecommunication Intercept Support Section; and the Telecommunication Attorney. In addition, we interviewed a Senior Counsel to the Assistant Attorney General for the Criminal Division of the Department of Justice and representatives from the following organizations:
- The Center for Democracy and Technology;
- The FCC;
- Steptoe & Johnson, LLP;
- Fiducianet, Inc.;
- Bell South;
- Verizon;
- Qwest;
- Verizon Wireless;
- SBC;
- Sprint;
- Cingular;
- Vonage;
- America Online; and
- Comcast.
We interviewed federal, state, and local law enforcement from five states with switches that were identified as high-priority by the FBI, and who were provided coverage by a different carrier in each state. To focus our review on switches with a higher priority, we used the FBI’s Flexible Deployment III database to identify switches with a priority score of 80 or higher. The database identified 512 switches with a priority score of 80 or higher and the switches are located in 18 different states as follows:
| State | Number of High- Priority Switches |
Main Carrier | |
|---|---|---|---|
1 |
Alaska |
2 |
ACS Wireless |
2 |
Arizona |
40 |
Qwest |
3 |
California |
116 |
SBC/Verizon |
4 |
D.C. |
12 |
Verizon |
5 |
Florida |
51 |
Bell South |
6 |
Hawaii |
4 |
Verizon |
7 |
Illinois |
28 |
SBC |
8 |
Indiana |
1 |
Cingular |
9 |
Louisiana |
3 |
Bell South |
10 |
Maryland |
46 |
Verizon |
11 |
Michigan |
26 |
SBC |
12 |
Nevada |
11 |
Sprint |
13 |
New Jersey |
2 |
Voice Stream Wireless |
14 |
New York |
95 |
Verizon |
15 |
Ohio |
11 |
SBC |
16 |
Pennsylvania |
18 |
Verizon |
17 |
Rhode Island |
5 |
Verizon |
18 |
Texas |
41 |
SBC |
TOTAL |
512 |
In order to select states that had a significant number of high‑priority switches, and to ensure that we reached the major carriers, we selected the following five states:
| State | Number of High- Priority Switches |
Targeted Carrier |
|
|---|---|---|---|
1 |
California |
116 |
SBC |
2 |
New York |
95 |
Verizon |
3 |
Florida |
51 |
Bell South |
4 |
Arizona |
40 |
Qwest |
5 |
Nevada |
11 |
Sprint |
TOTAL |
313 |
We reviewed the listing of switches within each state and visited the cities that the majority of the switches covered. We conducted interviews with law enforcement officials from the following agencies:
- New York
White Plains- New York State Attorney General's Office
- Westchester County District Attorney's Office
- U.S. Attorney's Office
- New York Police Department
- Suffolk County District Attorney's Office
- Florida
Tampa- Tampa Police Department
- Hillsborough County Sheriff's Office
- State Attorney's Office
- Florida Department of Law Enforcement
- FBI
- Broward County Sheriff's Office
- Miami-Dade Police Department
- Florida Department of Law Enforcement
- Arizona
Phoenix- State Attorney General's Office
- Maricopa County Attorney's Office
- Phoenix Police Department High Intensity Drug Trafficking Areas (HIDTA)
- U.S. Attorney's Office
- Pima County Attorney's Office (HIDTA)
- Tucson Police Department
- Pima County Sheriff's Department
- California
San Diego- DEA
- San Diego District Attorney's Office
- FBI
- Los Angeles District Attorney's Office
- DEA
- Los Angeles Clearinghouse (HIDTA)
- Central Valley (HIDTA)
- Nevada
Las Vegas- Las Vegas Metro Police Department
- State Attorney General's Office
- FBI
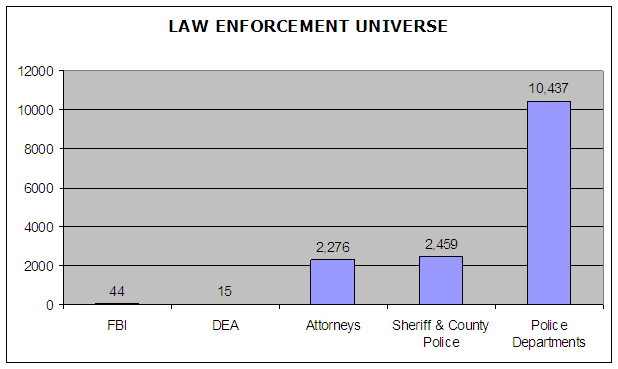
Based on our interviews with law enforcement from the five states listed above, we prepared a written survey to mail to a sample of federal, state, and local law enforcement officials. We obtained the universe of federal, state, and local law enforcement officials from the National Law Enforcement Administrators Directory. In selecting our sample, we did not include law enforcement officials from the states visited or the six states that do not have a wiretap law (Alabama, Arkansas, Kentucky, Michigan, Montana, and Vermont). Our universe of 15,231 federal, state, and local law enforcement agencies included the following categories:

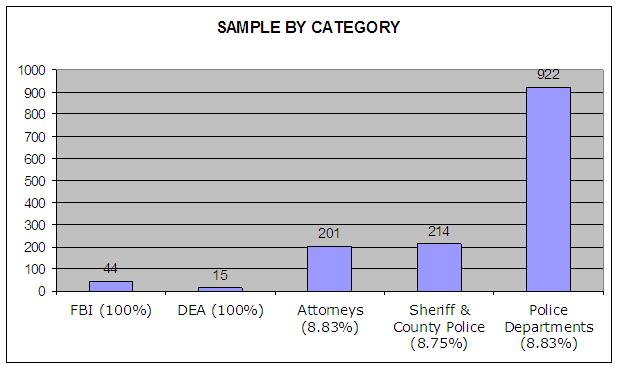
We selected the following sample which totals 1,396 (9.17 percent of the universe):

Of the 1,396 surveys mailed, we received 723 responses (51.79%). An analysis of the responses received is illustrated in the following table.
| RESPONSE RATES | ||||||
|---|---|---|---|---|---|---|
| AGENGY | SAMPLE | RESPONSES | AFFIRMATIVE RESPONSES |
NEGATIVE RESPONSES |
RESPONSE RATE |
AFFIRMATIVE RESPONSE RATE |
FBI |
44 |
36 |
36 |
0 |
81.82% |
81.82% |
DEA |
15 |
9 |
9 |
0 |
60.00% |
60.00% |
ATTORNEYS |
201 |
89 |
2 |
87 |
44.28% |
1.00% |
SHERIFF/CO PD |
214 |
118 |
11 |
107 |
55.14% |
5.14% |
POLICE DEPT |
922 |
471 |
24 |
447 |
51.08% |
2.60% |
TOTAL |
1396 |
723 |
82 |
641 |
51.79% |
5.87% |
We received responses from 82 agencies from 38 states that conduct electronic surveillance. The following table illustrates the affirmative responses by state and agency:
| AFFIRMATIVE RESPONSES BY STATE AND AGENCY |
|||||||
|---|---|---|---|---|---|---|---|
| STATE | FBI | DEA | ATTORNEYS | SHERIFF/ |
POLICE |
TOTAL | |
1 |
AK |
1 |
1 |
||||
2 |
AL |
2 |
2 |
||||
3 |
AR |
1 |
1 |
||||
4 |
CO |
1 |
1 |
2 |
|||
5 |
D.C. |
1 |
1 |
2 |
|||
6 |
GA |
1 |
1 |
1 |
3 |
||
7 |
HI |
1 |
1 |
||||
8 |
IA |
1 |
1 |
2 |
|||
9 |
IL |
1 |
1 |
1 |
3 |
6 |
|
10 |
IN |
1 |
1 |
||||
11 |
KS |
1 |
1 |
||||
12 |
KY |
1 |
1 |
||||
13 |
LA |
1 |
1 |
2 |
|||
14 |
MA |
1 |
1 |
||||
15 |
MD |
1 |
1 |
||||
16 |
MI |
1 |
1 |
2 |
|||
17 |
MN |
1 |
3 |
4 |
|||
18 |
MO |
2 |
1 |
1 |
4 |
||
19 |
MS |
1 |
1 |
||||
20 |
NC |
1 |
1 |
||||
21 |
NE |
1 |
1 |
||||
22 |
NJ |
1 |
1 |
2 |
|||
23 |
NM |
1 |
1 |
||||
24 |
OH |
1 |
2 |
5 |
8 |
||
25 |
OK |
1 |
1 |
||||
26 |
OR |
1 |
1 |
||||
27 |
PA |
1 |
1 |
3 |
5 |
||
28 |
PR |
1 |
1 |
||||
29 |
RI |
1 |
1 |
||||
30 |
SC |
1 |
1 |
2 |
|||
31 |
TN |
2 |
3 |
5 |
|||
32 |
TX |
3 |
1 |
4 |
|||
33 |
UT |
1 |
1 |
2 |
|||
34 |
VA |
2 |
2 |
||||
35 |
WA |
1 |
1 |
||||
36 |
WI |
1 |
1 |
2 |
4 |
||
37 |
WV |
1 |
1 |
||||
38 |
WY |
1 |
1 |
||||
TOTAL |
36 |
9 |
2 |
11 |
24 |
82 |
|
% |
43.90% |
10.98% |
2.44% |
13.41% |
29.27% |
||