In Chapter 4, we identified the overall results of our web-based survey. As noted, these analyses indicated that state and local law enforcement agencies were minimally affected by the FBI’s change in investigative priorities. Although the overall results primarily showed no impact on these departments, we performed additional analyses according to distinct criteria. Specifically, we reviewed the responses based upon field office jurisdiction, department size, and population. Each of these analyses mirrored the overall survey results, in other words, there was no significant variation in the outcome due to differing criteria. The following sections provide the results of these further analyses.
Field Office Jurisdictions
As discussed in the report, we disseminated the survey to state and local law enforcement agencies located in the jurisdictional areas of 12 FBI field offices. The following exhibit illustrates these locations, as well as the number of survey participants and recipients within each jurisdiction.
| Map of Survey Recipients [Not Available Electronically] |
| Source: Office of the Inspector General |
We reviewed the survey data according to the FBI field office jurisdictions in which the respondents were located. We focused on the survey questions that pertained to the impact of the FBI’s shift in priorities during the last three years. Through our analyses, we determined that the majority of respondents within each location were minimally affected by the FBI’s reprioritization. As such, we chose to further analyze the negative responses to determine if any locations indicated more of a negative impact than others.
General Traditional Crime Areas
We reviewed the negative responses by field office location in general traditional crime areas. In other words, we looked at the impact the FBI’s reprioritization had on the state and local law enforcement agencies’ efforts in addressing drugs, organized crime, violent crime, and white-collar crime. The following exhibit illustrates the results of this analysis.
| NEGATIVE IMPACT ON TRADITIONAL CRIME AREAS
ACCORDING TO FIELD OFFICE LOCATION |
|
|---|---|
Drugs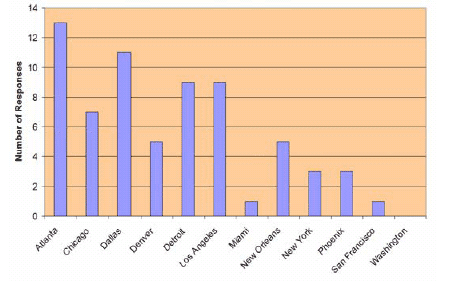 |
Organized Crime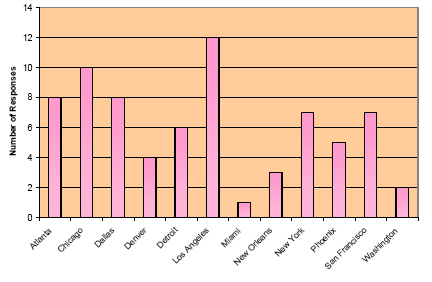 |
Violent Crime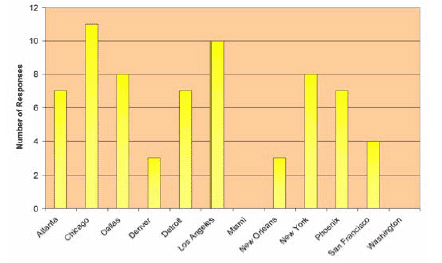 |
White-Collar Crime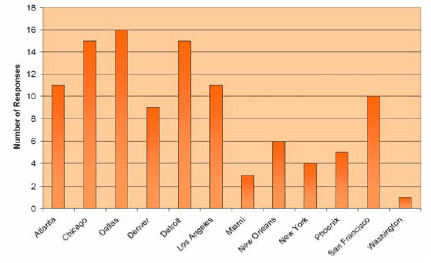 |
| Source: OIG analysis of survey responses | |
For drug-related matters, there were a total of 67 respondents from all 12 jurisdictions that indicated a negative effect on their operations. State and local law enforcement agencies located in the FBI Atlanta Field Office jurisdiction accounted for nearly 20 percent of the negative responses. In contrast, none of the respondents in the FBI Washington, D.C., Field Office jurisdiction noted a negative impact in this crime area.
In the area of organized crime, there were a total of 73 respondents that indicated a negative effect on their operations from the 12 jurisdictions. Two of the 12 locations (Chicago and Los Angeles) comprised over 30 percent of the negative replies.
Similar to organized crime, 21 of the 68 negative responses in violent crime came from agencies located in the Chicago and Los Angeles jurisdictions. Moreover, the jurisdictions of the FBI Miami and Washington, D.C., Field Offices did not disclose any negative effect from the FBI’s reprioritization in violent crime matters.
Regarding white-collar crime, we noted that agencies within each jurisdictional area revealed that their operations were negatively affected by the FBI’s shift in priorities. Of these four traditional crime areas, white-collar crime matters had the largest overall negative impact with 106 negative responses. Five of the 12 FBI jurisdictional areas (Atlanta, Chicago, Dallas, Detroit, and Los Angeles) comprised over 60 percent of the total negative responses, with the Dallas Field Office accounting for the largest percentage.
Law Enforcement Agency Size
In our survey, 1,171 participants identified their agency’s calendar year 2004 sworn-officer level. For our analysis, we judgmentally developed ranges of resource levels to determine if department size had any bearing on the degree to which agencies were negatively affected by the FBI’s shift in priorities. The following table provides the number of survey respondents within each range.
| SURVEY RESPONDENTS ACCORDING TO CALENDAR YEAR 2004 SWORN OFFICER LEVELS |
|
|---|---|
| Range of Sworn Officers | Number of Respondents |
| Less than 50 | 798 |
| 50 – 99 | 178 |
| 100 – 299 | 124 |
| 300 – 499 | 23 |
| 500 and Above | 48 |
| Source: OIG analysis of survey responses |
Within each range, we determined the number of respondents who indicated that agency operations were impaired as a result of the FBI’s reprioritization, specifically focusing on the traditional crime areas of drugs, organized crime, violent crime, and white-collar crime. The following graphs illustrate the negative impact on in these four crime areas as they relate to the size of law enforcement agencies.
| NEGATIVE IMPACT ON TRADITIONAL CRIME AREAS AS IT RELATES TO LAW ENFORCEMENT AGENCY SIZE |
|
|---|---|
Drugs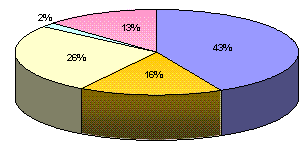 |
Organized Crime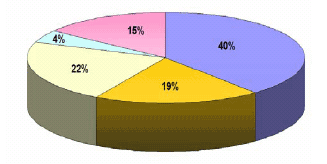 |
 |
|
Violent Crime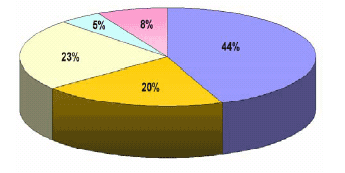 |
White-Collar Crime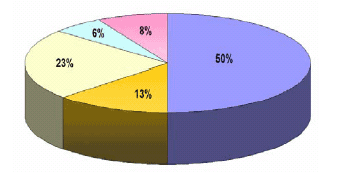 |
| Source: OIG analysis of survey responses | |
The majority of respondents noting a negative impact on their agency’s operations in these criminal areas were those departments with fewer than 50 sworn officers. Those agencies with 100 to 299 sworn officers accounted for the second largest group of negative responses in three of the four investigative areas: organized crime, violent crime, and white-collar crime. In contrast, those departments with 300 to 499 sworn officers or 500 sworn officers and above had the lowest percentage of total negative responses in each of these criminal areas.
Population
We further analyzed the survey responses based upon the population size that each agency serviced. Our survey asked participants the population of their jurisdictional area according to the 2000 Census. This analysis enabled us to determine if population size had any correlation to areas most impacted by the FBI’s reprioritization. The following table identifies the number of survey respondents within each population range.
| SURVEY RESPONDENTS ACCORDING TO POPULATION SIZE |
|
|---|---|
| Population Size | Number of Respondents |
| Less than 20,000 | 711 |
| 20,000 to 50,000 | 221 |
| 50,001 – 100,000 | 94 |
| 100,001 – 250,000 | 80 |
| Over 250,000 | 91 |
| Total | 1,197 |
| Source: OIG analysis of survey responses |
This analysis revealed that those agencies located in an area where the population was less than 20,000 experienced the largest impact in each of the 4 traditional crime areas as a result of the FBI’s shift in priorities. The second largest demographic negatively affected by the FBI’s reprioritization were those locations where the population ranged from 20,000 to 50,000, which occurred in 3 of the 4 crime areas.
| NEGATIVE IMPACT ON TRADITIONAL CRIME AREAS
ACCORDING TO POPULATION OF LAW ENFORCEMENT AGENCIES’ LOCATION |
|
|---|---|
Drugs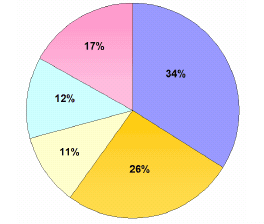 |
Organized Crime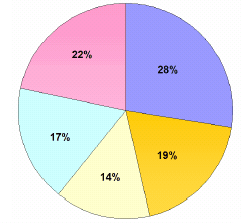 |
 |
|
Violent Crime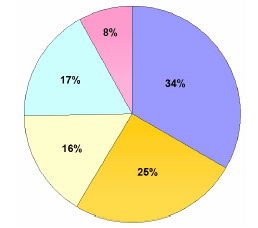 |
White-Collar Crime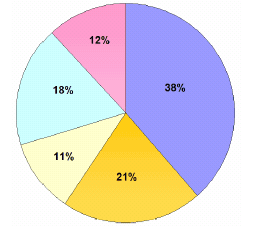 |
| Source: OIG analysis of survey responses | |


