In order to determine the specific investigative areas in which the FBI was concentrating its efforts, we reviewed resource utilization levels and casework data within the fiscal years covered by our review. While the FSL analysis in Chapter 2 assesses the FBI's planned resource usage, the examination of resource utilization in this chapter shows the types of investigations FBI personnel actually spent time performing. Moreover, the analysis of casework data provides additional information on certain investigative areas. We conducted these analyses to identify the areas of change in the FBI's operational efforts as a result of its reprioritization and reprogramming.
Based on our analyses of this FBI timekeeping data, we found that the FBI utilized agent resources consistent with its mandate to make combating terrorism its primary focus. Moreover, during FY 2003, agent resources were utilized above the allocated levels for matters related to the FBI's three highest priorities - counterterrorism, counterintelligence, and cyber crime. We also found that most of our casework analyses supported the same conclusions. The results of our analyses also specifically identified investigative areas in which the FBI significantly changed its resource utilization, either by increasing or decreasing its effort. To comply with FBI priorities, resources dedicated to terrorism matters significantly increased.
As discussed in Chapter 2, resources were transferred from traditional criminal investigative programs, specifically, the Organized Crime/Drug (OC/D), White Collar Crime (WCC), and Violent Crime/Major Offenders (VCMO) programs, to programs related to combating terrorism. We found certain investigative areas, mostly within the OC/D, WCC, and VCMO programs, to be significantly affected by the reduction in funded agent resources. Moreover, in traditional crime programs, actual agent resource utilization decreased at an even greater rate than what was allocated. Therefore, the FBI's transformation significantly impacted the number of agents investigating traditional crime, even beyond what the FBI had planned.
The FBI uses the Time Utilization and Recordkeeping (TURK) system to record time spent by most FBI field office personnel on various types of investigative matters.29 The TURK system requires field agents to report daily the proportion of their time worked in FBI investigative classifications. Therefore, the data derived from the FBI TURK system is only as valid as the information reported by FBI field agents. TURK data is recorded for the following personnel:
| AGENTS | SUPPORT PERSONNEL |
|
|
For each agent (or support employee) the FBI TURK system maintains the percentage of time worked each day according to FBI investigative classifications, which the FBI calls Average on Board (AOB). The percentages are based on a 10-hour day for agents and an 8-hour day for support personnel. The FBI considers the TURK system's AOB data to be the best way to assess the actual amount worked by FBI employees in specific FBI investigative programs, sub programs, and classifications. For the purposes of this report, we use the term AOB and on board employee (agent or support) interchangeably.
Although time and attendance data is recorded daily by FBI personnel, data collection in the TURK system is divided into 13 TURK periods each fiscal year, making each TURK period consist of 2 pay periods. For example, the terrorist attacks on September 11, 2001, occurred during TURK period 13 of FY 2001.
Investigative Programs, Sub programs, and Classifications
The FBI assigns each of its cases to an investigative classification based on the crime that is being investigated. The investigative classification is the greatest level of detail to which the FBI tracks resource utilization. Each classification is assigned to a program and, if appropriate, a sub-program. An example of this is detailed in Exhibit 3-1. If a "TURKing" FBI employee worked a bank robbery case, the percentage of time worked would be recorded for Classification 091A (Bank Robbery), which is within the Violent Incident Crimes sub program of the Violent Crime/Major Offenders Program.
EXHIBIT 3-1
FBI INVESTIGATIVE NOMENCLATURE
| Category | Name | Indicator |
|---|---|---|
| Program | Violent Crime/Major Offenders | VCMO |
| Sub-program | Violent Incident Crimes | VC |
| Classification | Bank Robbery | 091A |
| Source: FBI Finance Division |
Data Collection - We obtained TURK AOB information for both agent and support personnel from September 26, 1999, through September 20, 2003.30 The universe included a total of 1,009,971 records, consisting of agent AOB captured for each FBI field office at the program, sub program, and investigative classification level for each TURK period of our reviewed timeframe.
Data Analysis - In general, we analyzed AOB data by fiscal year. Exhibit 3-2 shows the total agent AOB from FYs 2000 through 2003 for the FBI as a whole. Agent utilization within field offices has decreased by nearly 400 agents since FY 2000. A large portion of this decrease is related to a hiring freeze the FBI experienced in FY 2001, often referred to by the FBI as the "hollow work year" issue.31
EXHIBIT 3-2
TOTAL FBI ON-BOARD FIELD AGENTS
FISCAL YEARS 2000 THROUGH 2003
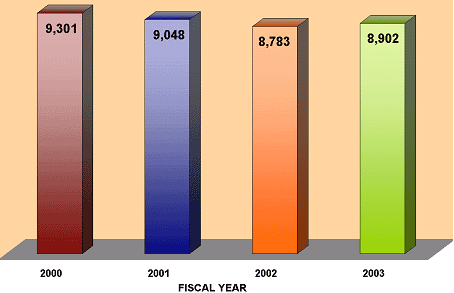
Source: OIG analysis of FBI TURK data
Agent Utilization at the FBI Program Level
We further analyzed agent resource utilization by reviewing AOB at the program level for FYs 2000 through 2003. However, it must be noted that both the WCC and VCMO programs had sub programs transferred to the new Cyber Crime Program (CCP) and Criminal Enterprise Investigations (CEI) Program for FY 2003, as detailed in Exhibit 3 3.
EXHIBIT 3-3
SUB-PROGRAMS TRANSFERRED BETWEEN PROGRAMS
| Sub-program | FYs 2000 - 2002 Program | FY 2003 Program |
|---|---|---|
| Intellectual Property Rights | WCC | CCP |
| Innocent Images Initiative | VCMO | CCP |
| OCDETF - VCMO | VCMO | CEI |
| Major Theft | VCMO | CEI |
| Violent Gangs | VCMO | CEI |
| Source: FBI Finance Division |
Therefore, to accurately compare the change in the FBI's investigative efforts at the program level, we adjusted the WCC and VCMO programs' agent utilization figures for FY 2003 to encompass the transferred sub programs' agent utilization data. Exhibit 3-4 illustrates the average agent utilization within each FBI program for FYs 2000 through 2003, charting the change in the number of agent resources investigating cases within particular programs.
EXHIBIT 3-4
AGENT UTILIZATION WITHIN FBI PROGRAMS
ADJUSTED FOR SUB PROGRAMS TRANSFERRED
FISCAL YEARS 2000 THROUGH 2003
| CLASSIFIED INFORMATION REDACTED |
| Source: OIG analysis of FBI TURK data |
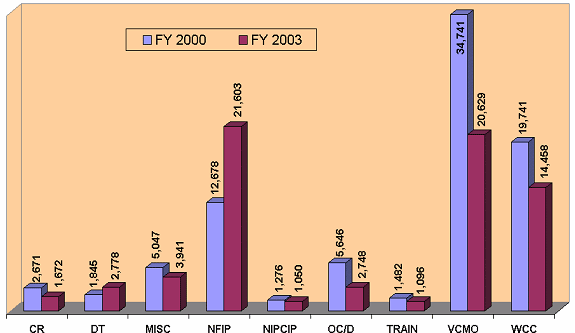
As evidenced in Exhibit 3-4, traditional crime area programs, specifically the WCC, OC/D, and VCMO programs, experienced significant agent resource reductions during our review period.32 This reduction in resources is in accord with FBI officials' statements that resources were transferred from traditional crime programs to terrorism-related efforts. Conversely, the National Foreign Intelligence Program (NFIP) experienced a large increase in agent utilization. Between FYs 2000 and 2002, [CLASSIFIED INFORMATION REDACTED]. This increase coincides with the FBI's changed priorities in counterterrorism and counterintelligence matters.
As noted in Chapter 1, the 9/11 attacks caused agent utilization data at the end of FY 2001 and throughout the first half of FY 2002 to be skewed towards terrorism-related matters. Therefore, in order to conduct a better comparison of resource utilization within the FBI, we concentrated our analysis on comparing FY 2000 data to FY 2003 data. This approach provided a view of resource utilization both before and well into the FBI's reprioritization efforts, revealing the areas of greatest change in actual agent (and support personnel) time worked at the program, sub program, and classification levels.
We computed the change in agent utilization within the FBI programs, as shown in Exhibit 3-5. Again, we adjusted the VCMO and WCC programs to reflect the programs' sub program composition in FY 2000.33 The program experiencing the largest increase in the number of agents working its investigations was NFIP, [CLASSIFIED INFORMATION REDACTED] in FY 2003. Traditional crime programs - VCMO, WCC, and OC/D - experienced the largest reductions in agent utilization. These resource changes correlate with the FBI's new priorities and its changes to agent allocations (FSLs).
EXHIBIT 3-5
ON BOARD AGENT CHANGES IN FBI PROGRAMS
FISCAL YEARS 2000 AND 2003
| CLASSIFIED INFORMATION REDACTED |
| Source: OIG analysis of FBI TURK data |
In addition to analyzing the change in the number of agents utilized within each program between FYs 2000 and 2003, we evaluated the proportion of the total number of agents utilized in each program, as graphically presented in Exhibit 3-6. These charts show the percentage of FBI agent resources used within each program for FYs 2000 and 2003. As shown, the largest decrease occurred in the OC/D Program; of the total investigative agents in each fiscal year, the OC/D Program utilized 10 percent fewer agents in FY 2003 than in FY 2000. Alternatively, the percentage of total agents investigating [CLASSIFIED INFORMATION REDACTED].
EXHIBIT 3-6
AGENT UTILIZATION AS A PERCENTAGE OF
TOTAL AGENT RESOURCES
FISCAL YEARS 2000 AND 2003
| FISCAL YEAR 2000 | FISCAL YEAR 2003 |
| CLASSIFIED INFORMATION REDACTED | |
| Source: OIG analysis of FBI TURK data |
Exhibit 3-4, Exhibit 3-5, and Exhibit 3-6 show that, before the FBI's reprioritization, the traditional criminal programs - WCC, OC/D, and VCMO - used more agent resources than other programs. However, subsequent to the reprioritization, NFIP, compared to all other programs, utilized the largest percentage of total FBI field agent resources and increased its agent utilization more than any other program.
Comparison of Agent Allocation to Utilization
As discussed in Chapter 2, the FBI allocates agent resources in terms of Funded Staffing Levels (FSLs). The data discussed within this chapter focuses on agent utilization - how agent resources were actually used. Exhibit 3 7 graphically compares allocated to actual field agent data for FYs 2000 through 2003. The difference between the allocated resources (FSLs) and actual resources utilized (on-board agents) generates what the FBI refers to as the "burn rate." In FY 2001, the FBI experienced an "overburn," which occurs when resources are utilized at a level above the FSL; the overburn in FY 2001 was 165 agents. An "underburn" occurs when resources are utilized at a level below the FSL. This was the case in FYs 2000, 2002, and 2003. The largest underburn during our review period occurred in FY 2002; the FBI utilized 128 fewer on board agents than it was allocated.
EXHIBIT 3-7
COMPARISON OF FIELD AGENT ALLOCATION TO UTILIZATION
FISCAL YEARS 2000 THROUGH 200334
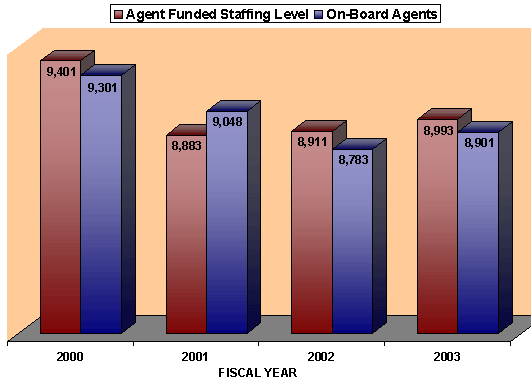
Source: OIG analysis of FBI TURK data and Resource Management and Allocation Office data
To better assess how the FBI's reprioritization of terrorism related work has affected its agent utilization since 9/11, we compared burn rates in two broad investigative categories: terrorism related and non terrorism related.35 As seen in Exhibit 3 8, in FY 2003 the FBI experienced an overburn of 845 field agent resources in terrorism-related matters and an underburn of 879 agent resources in non terrorism related matters.
EXHIBIT 3-8
COMPARISON OF FIELD AGENT ALLOCATION TO UTILIZATION
FISCAL YEAR 200336
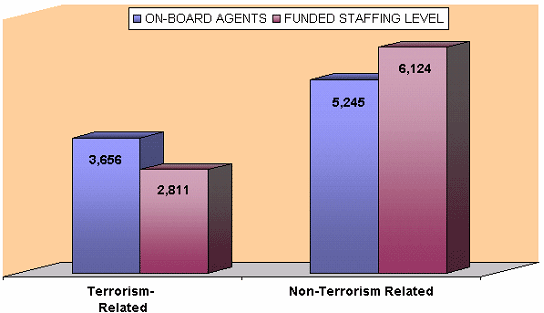
Source: OIG analysis of FBI TURK and Resource Management and Allocation Office data
Casework at the FBI Program Level
In addition to agent utilization, we reviewed the universe of all field office cases in the ACS system during our review period and compared the number of cases opened, by program, in FY 2000 to those opened in FY 2003. We found that by FY 2003, the FBI opened fewer cases in traditional criminal areas and more in those areas related to terrorism. As shown in Exhibit 3 9, the number of cases opened in the National Foreign Intelligence Program (NFIP) and Domestic Terrorism (DT) Program increased between the two periods, while the number of cases opened in the OC/D, WCC, and VCMO programs decreased.
EXHIBIT 3-9
FIELD OFFICE CASES OPENED IN FBI PROGRAMS
FISCAL YEARS 2000 AND 200337
Source: OIG analysis of FBI ACS data
Specifically, the FBI opened 8,925 more NFIP cases in FY 2003 than in FY 2000, reflecting an increase of more than 70 percent. The FBI opened over 50 percent more Domestic Terrorism cases in FY 2003 than in FY 2000. In contrast, the FBI opened over 50 percent fewer Organized Crime/Drug cases, 40 percent fewer Violent Crime cases, and more than 25 percent fewer White Collar Crime cases in FY 2003 than in FY 2000. The FBI also opened fewer Civil Rights, Training, and National Infrastructure Protection/Computer Intrusion cases in FY 2003 compared to FY 2000.
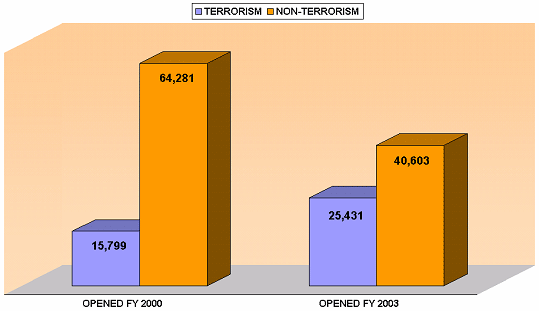
We then consolidated the data found in Exhibit 3 9 into terrorism and non terrorism related matters in order to review how trends in case openings within these two broader categories changed from FY 2000 to FY 2003. As shown in Exhibit 3 10, we found that the FBI increased the number of terrorism related cases it opened by more than 60 percent and reduced the number of non terrorism related cases it opened by 37 percent during our review period.
EXHIBIT 3-10
TERRORISM RELATED AND NON-TERRORISM RELATED
FIELD OFFICE CASES OPENED
FISCAL YEARS 2000 AND 200338
Source: OIG analysis of FBI ACS data
Agent Utilization and Casework at the FBI Classification Level
To obtain the most detailed information possible, we analyzed agent utilization at the investigative classification level between FYs 2000 and 2003. Since our focus was on the FBI's investigative efforts, we eliminated training and administrative classifications tracked within the TURK system from this analysis. Also, classifications that changed or existed in only one of the two fiscal years examined were not included in the analysis.39
During our analysis, we recognized the large impact of percent changes in agent utilization within classifications or programs. This is best explained by an example. In Classification 281A (OC/DI LCN and Italian Organizations) the Albany Field Office experienced a reduction from 0.49 agents in FY 2000 to 0.03 in FY 2003, a 95 percent change.40 Therefore, even though Albany dedicated very few resources to investigating Classification 281A matters in any fiscal year, when looking at the percent change, one is led to believe that Albany was significantly impacted by its reduction in agent resources conducting such investigations. Thus, given this example, it would be misleading to focus exclusively on percent changes. Therefore, we focused our analysis primarily on total on board agent changes. Still, percent changes cannot be entirely discounted, and we present them when they are appropriate for our analyses.
Increase in Resource Utilization - The FBI lists counterterrorism and counterintelligence as its top two priorities and, as discussed, it has transferred large amounts of resources to target these two priorities. As a result, a great majority of the investigative classifications experiencing the largest increase in agent utilization are related to counterterrorism and counterintelligence. This became apparent when we analyzed the TURK data and identified the 30 investigative classifications experiencing the greatest on board agent increases between FYs 2000 and 2003. Our results are displayed in Exhibit 3 11.
EXHIBIT 3-11
30 CLASSIFICATIONS EXPERIENCING
THE GREATEST INCREASES IN AGENT UTILIZATION
BETWEEN FISCAL YEARS 2000 AND 2003
| Classification Number | Classification Name | AOB Change FYs 2000- 2003 | |
|---|---|---|---|
| Number | Percent | ||
| CLASSIFIED INFORMATION REDACTED | |||
| CLASSIFIED INFORMATION REDACTED | |||
| CLASSIFIED INFORMATION REDACTED | |||
| CLASSIFIED INFORMATION REDACTED | |||
| CLASSIFIED INFORMATION REDACTED | |||
| 196C | Securities/Commodities Fraud | 73 | 54 |
| CLASSIFIED INFORMATION REDACTED | |||
| 266A | AOT-DT - Violent Crimes - Predicate Offense | 37 | 30 |
| 306 | Serial Killings | 28 | 1,201 |
| CLASSIFIED INFORMATION REDACTED | |||
| CLASSIFIED INFORMATION REDACTED | |||
| CLASSIFIED INFORMATION REDACTED | |||
| 067D | Support Applicant Investigations | 21 | 264 |
| CLASSIFIED INFORMATION REDACTED | |||
| 067B | Special Agent Applicant Investigations | 18 | 138 |
| CLASSIFIED INFORMATION REDACTED | |||
| CLASSIFIED INFORMATION REDACTED | |||
| CLASSIFIED INFORMATION REDACTED | |||
| 089B | Assaulting or Killing a Federal Officer | 11 | 72 |
| CLASSIFIED INFORMATION REDACTED | |||
| 164C | Crime Aboard Aircraft - All other | 11 | 374 |
| CLASSIFIED INFORMATION REDACTED | |||
| 253A | Fraud & Rel Activity - Ident Documents (FRAID) - Terrorists | 10 | 747 |
| 174D | Bomb Technician Activities | 8 | 46 |
| 300B | CT Preparedness - Aviation Security | 8 | 523 |
| CLASSIFIED INFORMATION REDACTED | |||
| CLASSIFIED INFORMATION REDACTED | |||
| 261G | Security Officer Matters - Other | 6 | 213 |
| CLASSIFIED INFORMATION REDACTED | |||
ACRONYMS:
|
|
| |
Twenty four of the 30 investigative classifications listed in Exhibit 3 11 fell under the National Foreign Intelligence Program (NFIP) and the Domestic Terrorism (DT) Program. The largest total on-board agent increase occurred within NFIP in Classification 265A (AOT-IT - Violent Crimes Predicate Offense).
Six of the 30 classifications listed in Exhibit 3 11 are from programs not related to terrorism. The classification undergoing the largest increase in this group, 196C (Securities/Commodities Fraud), is from the White Collar Crime Program. Three other classifications are within the VCMO Program: 306 (Serial Killings), 089B (Assaulting or Killing a Federal Officer), and 164C (Crime aboard Aircraft - All Other). The remaining two classifications - 067D (Support Applicant Investigations) and 067B (Special Agent Applicant Investigations) - are applicant classifications.
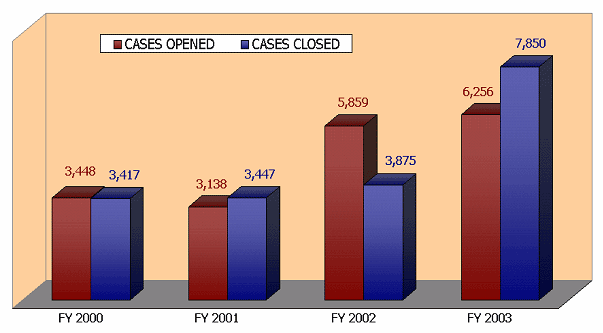
Casework - We also reviewed casework data from the FBI's Automated Case Support (ACS) system and found that 22,993 cases (6 percent) from the original universe of 404,318 cases worked during our review period fell into one of the 30 investigative classifications undergoing the largest increase in on board agents.41 We also noted a general upward trend in total case openings in these classifications. The only variation noted was a slight decrease of 310 cases between FYs 2000 and 2001. By FY 2003, the FBI had opened 2,808 more cases in these classifications than it had in FY 2000, an increase of 81 percent. Additionally, as shown in Exhibit 3 12, the FBI closed more cases in these classifications in each fiscal year of the review period, culminating in a high of 7,850 case closures in FY 2003. This amounts to an increase of 130 percent compared to FY 2000.
EXHIBIT 3-12
OVERALL CASES OPENED AND CLOSED IN
THE TOP 30 INCREASING CLASSIFICATIONS
FISCAL YEARS 2000 THROUGH 2003
Source: OIG analysis of FBI ACS data
Exhibit 3 13 highlights changes in the number of cases opened within each of these classifications between FYs 2000 and 2003.42 Our review determined that the largest increase in case openings was in Classification [CLASSIFIED INFORMATION REDACTED]. We also noted a significant increase in cases involving Usama Bin Laden (199N), as well as foreign counterintelligence cases [CLASSIFIED INFORMATION REDACTED]. These findings are consistent with the FBI's mandate to prioritize terrorism-related work. The large amount of work in Classification 199N is also logical in light of Usama Bin Laden's connection to the terrorist attacks of 9/11. The large amount of work in classifications [CLASSIFIED INFORMATION REDACTED].
EXHIBIT 3-13
CHANGES IN CASE OPENINGS IN THE CLASSIFICATIONS EXPERIENCING
THE GREATEST INCREASES IN AGENT UTILIZATION
FISCAL YEARS 2000 AND 2003
| CLASSIFIED INFORMATION REDACTED |
| Source: OIG analysis of FBI ACS data |
We noted a few classifications in which case openings decreased. The classification with the most significant reduction in case openings, Securities/Commodities Fraud (196C), opened 266 fewer cases in FY 2003 than in FY 2000.
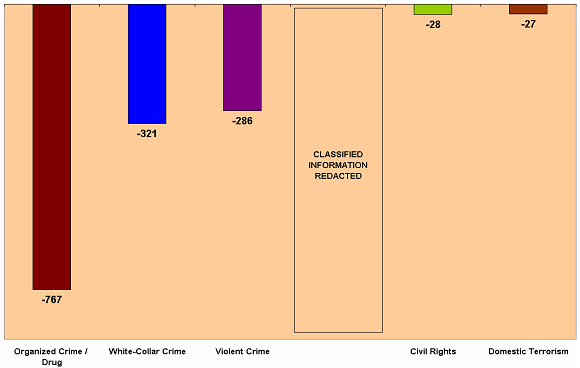
Reduction in Resource Utilization - In addition to identifying the investigative classifications experiencing the largest agent utilization increases, we identified the investigative classifications with the greatest reductions in agent utilization between FYs 2000 and 2003. Again, we did not include classifications related to training or administrative matters. In addition, we did not include any classifications that changed or were eliminated between FYs 2000 and 2003.43 The 30 investigative classifications experiencing the largest reduction in agent utilization are listed in Exhibit 3-14.
EXHIBIT 3-14
30 CLASSIFICATIONS EXPERIENCING
THE GREATEST REDUCTIONS IN AGENT UTILIZATION
BETWEEN FISCAL YEARS 2000 AND 2003
| Classification Number | Classification Name | AOB Change FYs 2000- 2003 | |
|---|---|---|---|
| Number | Percent | ||
| 245C | OCDETF - Mexican Organizations | -123 | -44 |
| 281C | OC/DI - Mexican Organizations | -119 | -63 |
| 281A | OC/DI - LCN and Italian Organizations | -103 | -34 |
| 088A | Unlawful Flight to Avoid Prosecution - Crime of Violence | -101 | -60 |
| 209A | Health Care Fraud - Government Sponsored Program | -89 | -36 |
| 091A | Bank Robbery | -81 | -26 |
| 281F | OC/DI - Other Major Criminal Organizations | -76 | -70 |
| 245F | OCDETF - Other Major Criminal Organizations | -62 | -54 |
| 245B | OCDETF - Central/South American Organizations | -61 | -53 |
| CLASSIFIED INFORMATION REDACTED | |||
| 029C | FIF - $25K - $99,999 Fed-Insured Bank | -50 | -67 |
| 281B | OC/DI - Central/South American Organizations | -44 | -70 |
| 281I | OC/DI - Caribbean Organizations | -43 | -76 |
| 281E | OC/DI - Asian Organizations | -40 | -34 |
| 196A | Telemarketing Fraud | -38 | -62 |
| 245D | OCDETF - VCMO - Gangs | -37 | -28 |
| 196D | Other Wire & Mail Fraud Schemes | -35 | -14 |
| 209B | Health Care Fraud - Private Ins. Program | -32 | -34 |
| 245I | OCDETF - Caribbean Organizations | -31 | -45 |
| 087B | Interstate Transportation of Stolen Property - $25K+ | -29 | -56 |
| 026B | ITSMV - Commercial Theft or Chop Shops | -29 | -62 |
| 092C | Racketeering Enterprise Investigations - Mexican Organizations | -28 | -66 |
| 196B | Insurance Fraud | -28 | -51 |
| 282A | Civil Rights - Color of Law - Force &/or Violence | -28 | -34 |
| 300A | Counterterrorism Preparedness - Special Events | -27 | -43 |
| 049A | Bankruptcy Fraud $50K+ /or Court Officer | -26 | -59 |
| 249A | Environmental Crimes | -25 | -75 |
| 244 | Hostage Rescue Team | -24 | -35 |
| CLASSIFIED INFORMATION REDACTED | |||
| 015B | TFIS - Loss of $25K; Weapons, Explosives | -21 | -60 |
| ACRONYMS: | |||
| OCDETF = | Organized Crime Drug Enforcement Task Force |
ITSMV = | Interstate Transportation of Stolen Motor Vehicles |
| OC/DI = | Organized Crime/Drug Investigations | TFIS = | Theft From Interstate Shipment |
| LCN = | La Cosa Nostra | ||
| FIF = | Financial Institution Fraud | ||
|
|||
Organized crime and drug related matters accounted for 12 of the 30 investigative classifications experiencing the largest reductions in agent resource utilization. In fact, 3 of these 12 classifications had reductions of over 100 on board agents: Classification 245C (OCDETF - Mexican Organizations), Classification 281C (OC/DI - Mexican Organizations), and Classification 281A (OC/DI - LCN and Italian Organizations). In addition to the 12 classifications relating to organized crime and drug matters, 8 were white-collar crime classifications, 3 were criminal enterprise classifications, 3 were violent crime classifications, 2 came from NFIP, and 1 each came from DT and Civil Rights. The on board agent changes are summarized by program areas in Exhibit 3 15.
EXHIBIT 3-15
AGENT UTILIZATION CHANGE WITHIN PROGRAM AREAS
FOR THE 30 CLASSIFICATIONS EXPERIENCING
THE GREATEST REDUCTIONS IN AGENT UTILIZATION
FISCAL YEARS 2000 AND 2003
Source: OIG analysis of FBI TURK data
The FBI officials we spoke with prior to our data analysis stated that the OC/D, VCMO, and WCC programs were the investigative programs most affected by the reprioritization and reprogramming. Our analysis of agent utilization reductions at the FBI investigative classification level, as well as at the FBI program level, is consistent with their statements. The reductions in these matters are discussed in more detail in Chapter 4.
Casework - We reviewed our original universe of cases worked during our review period to isolate those falling within the top 30 decreasing classifications. We identified 121,798 cases that met these criteria, reflecting 30 percent of the original sample. We then reviewed the data and found that bank robbery investigations (Classification 091A) accounted for 41,336 of these cases, by far the largest number of cases in any single classification.44 The next largest classification, violent fugitive investigations (Classification 088A), accounted for 31,788 cases. When combined, these two classifications accounted for 60 percent of the 121,798 cases identified as being part of this sample.
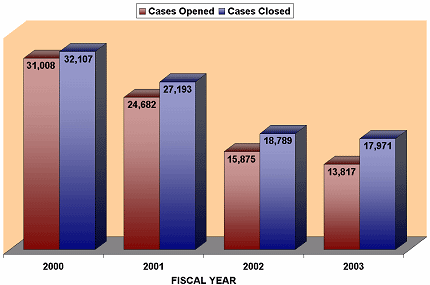
Using our sample of 121,798 cases, we determined the total number of cases opened and closed during each fiscal year of our review period. We found that within these classifications, in addition to opening fewer cases in each subsequent fiscal year of the review period, the FBI opened over 17,000 fewer cases in FY 2003 than in FY 2000. Case closings reflected a similar downward trend, with a 44 percent reduction between FYs 2000 and 2003. These results are presented in Exhibit 3 16.
EXHIBIT 3-16
TOTAL CASES OPENED AND CLOSED IN
THE TOP 30 CLASSIFICATIONS EXPERIENCING THE
GREATEST REDUCTIONS IN AGENT UTILIZATION
FISCAL YEARS 2000 THROUGH 2003
Source: OIG analysis of FBI ACS data
We then reviewed the data to determine how specific case openings changed before and after 9/11. Exhibit 3 17 highlights, for the 30 classifications experiencing the largest AOB reductions, the most significant reduction in the number of cases opened occurred in the investigations of violent fugitives (088A), where the FBI initiated 11,617 fewer cases in FY 2003 than it did in FY 2000. No other reductions in openings were as significant. The result for bank robbery cases (091A) was notable because although the FBI reduced its utilization of resources in this classification by 26 percent during our review period, the FBI actually opened 485 more cases in FY 2003 than in FY 2000.
EXHIBIT 3-17
CHANGES IN CASE OPENINGS IN THE TOP 30 CLASSIFICATIONS
EXPERIENCING THE GREATEST REDUCTIONS IN AGENT UTILIZATION
FISCAL YEARS 2000 AND 2003
| [Image Not Available Electronically] |
| Source: OIG analysis of FBI ACS data |
Overall, our assessment of utilization rates by program areas confirms that the FBI focused its field agent resources according to its stated priorities. In addition, the FBI used considerably more field agents in terrorism-related matters than it had projected in FY 2003. In fact, the FBI overburned field agent resources in areas related to its top three priorities - counterterrorism, counterintelligence, and cyber crime. Conversely, resources dedicated to criminal investigative matters did not reach the allocated staffing levels; during FY 2003, the FBI utilized significantly fewer field agents than it had allocated in criminal investigative matters.
We designed a portion of our analyses to identify the specific investigative classifications most affected by the FBI's shift in effort during our review period. The majority of the top 30 classifications that experienced the greatest increases in field agent utilization were related to terrorism. Conversely, most of the top 30 classifications that experienced the largest reductions in agent utilization were related to the FBI's more traditional, criminal investigative efforts. Only 3 of the 30 classifications in which agent usage decreased the most focused on terrorism related matters.
Our specific analyses of casework data revealed that the greatest decreases in case openings occurred in traditional criminal areas where the FBI stated it planned to reduce its efforts, while increases in case openings occurred mainly in programs related to terrorism. Specifically, our analysis of all cases in our universe revealed significant increases in case openings in national foreign intelligence and domestic terrorism matters between FYs 2000 and 2003, and significant decreases in case openings in both violent crime and white collar crime investigations for the same timeframe.
As noted in this chapter, as well as in Chapter 2, the FBI primarily reduced its investigative efforts in three traditional crime areas: organized crime/drugs, violent crime, and white-collar crime. In Chapter 4, we discuss the changes that occurred in the allocation and utilization of field agent resources within these three program areas, as well as direction given to field offices in these areas by FBI management.
Footnotes
- FBI Headquarters personnel are not required to record their time in TURK because, generally, they do not work on specific investigative matters. In addition, top level management within FBI field offices do not record time in TURK.
- September 26, 1999, through September 20, 2003, encompass FYs 2000 through 2003 in the TURK system. Because TURK periods are comprised of pay periods, fiscal years in the TURK system do not always end on September 30 or begin on October 1.
- The hollow work year issue is discussed in Chapter 2.
- A more detailed discussion of these programs and their agent utilization reductions is contained in Chapter 4.
- Exhibit 3-3 details which sub-programs were transferred from the VCMO and WCC programs to the CEI Program and CCP.
- On board agent data only captures non-supervisory field agents, including ERTs and TTAs. Therefore, we excluded management positions allocated to field offices from this analysis.
- The FSL and on-board agent data for "Terrorism-Related" and "Non-Terrorism Related" correspond with the categories listed in Exhibit 2-7.
- On board agent data only captures non-supervisory field agents. Therefore, we excluded management positions allocated to field offices from this analysis.
- The VCMO and WCC totals were adjusted to reflect the sub programs from each that moved into new programs in FY 2003, as noted in Exhibit 3-3.
- Case openings in the MISC program, which are captured in Exhibit 3 9, are not included in this analysis because they are generally administrative (non investigative) in nature.
- The classifications eliminated from our review are noted in Appendix I.
- According to the FBI, La Cosa Nostra (LCN) is a nationwide alliance of organized criminals with its roots in Italian Organized Crime.
- We designated a case as "worked" if it was open at any point during our review period. Additionally, case counts for each classification in the top 30 increasing classifications are contained in Appendix VI.
- Exhibit 3-13 contains only 28 of the 30 investigative classifications that experienced the largest increases in agent utilization. Classifications 067B (Special Agent Applicant Investigations) and 067D (Support Applicant Investigations) were excluded from this review because only 15 cases within these classifications were captured in both fiscal years reviewed. Based on a review of the data file, it appears that these types of investigations are opened by FBI Headquarters, rather than FBI field offices.
- The classifications eliminated from our review are noted in Appendix I.
- Case counts for the top 30 decreasing classifications are found in Appendix VI.
Redacted and Unclassified